 opCharts
Interactive Dashboards And Charts
Overview
Complete Dashboarding Solution To Visualize IT Infrastructure
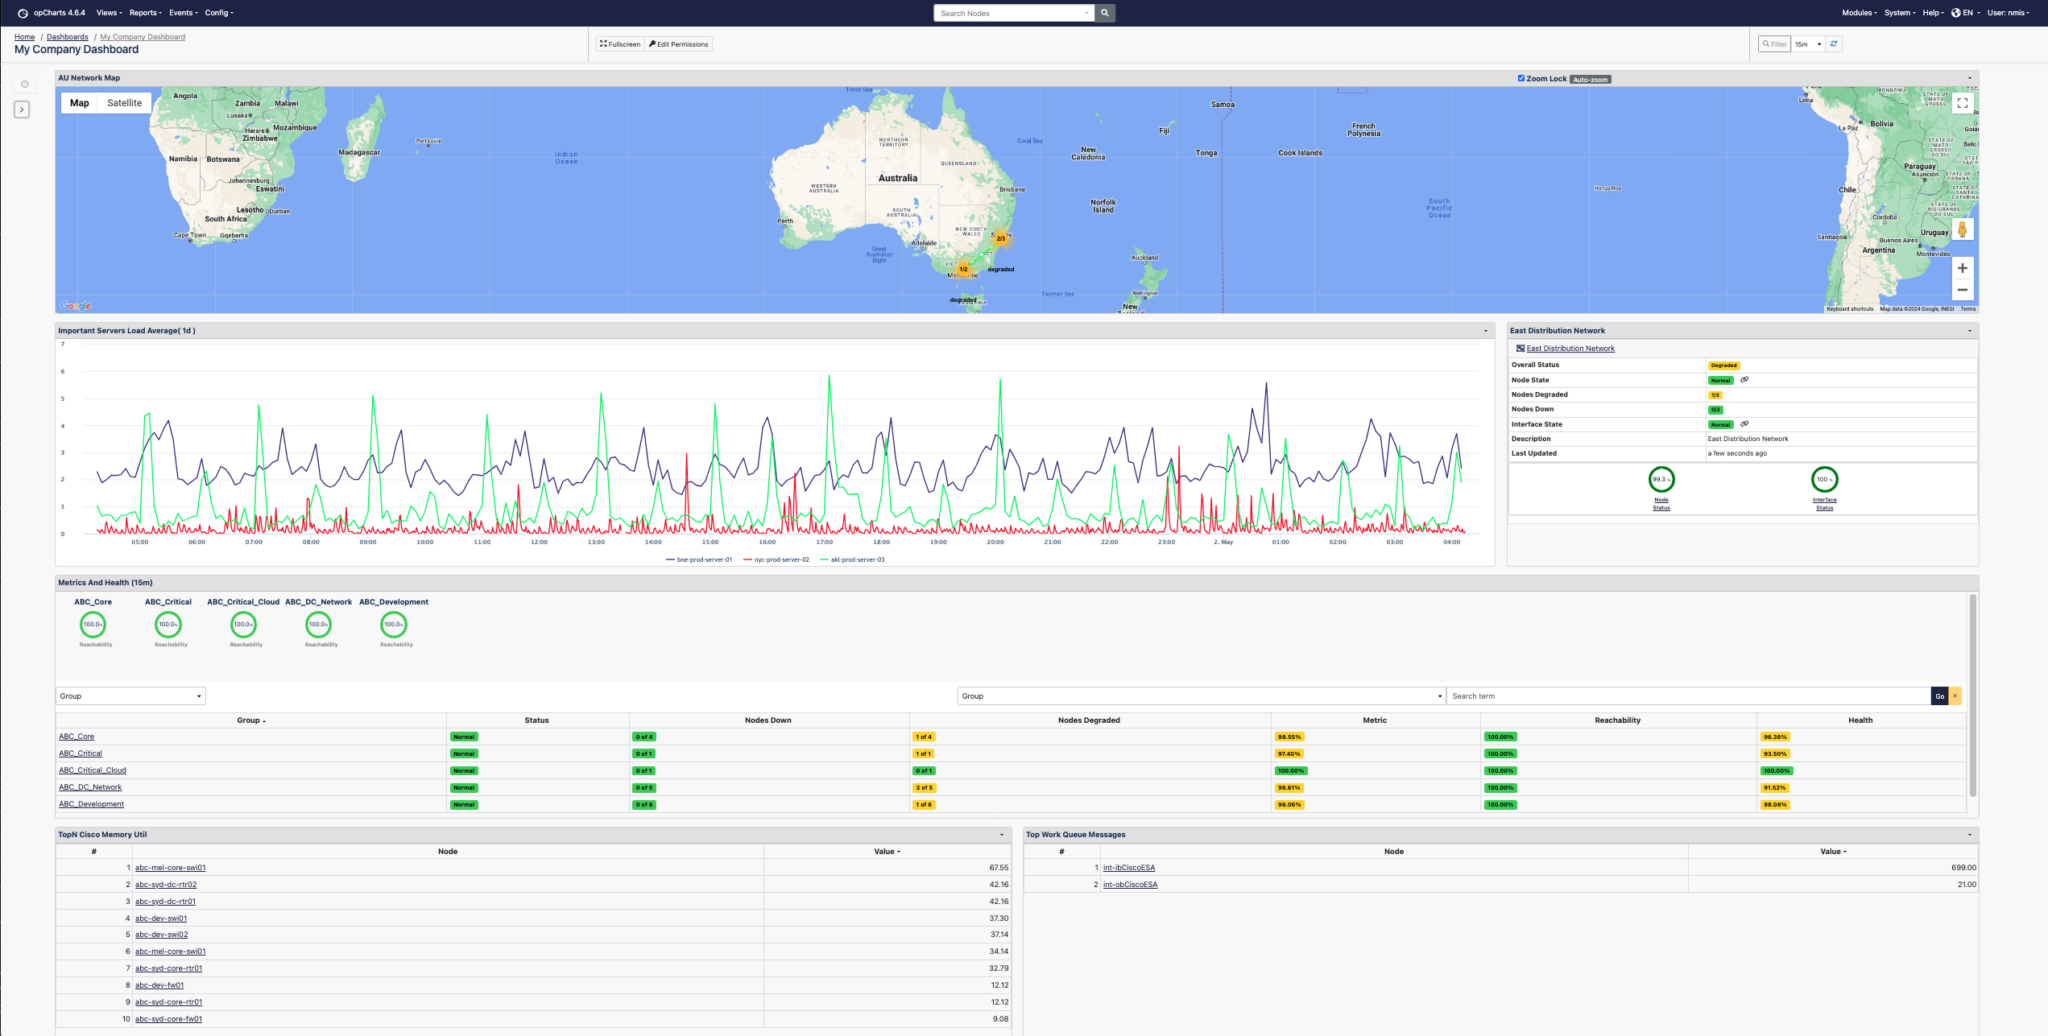
opCharts captures all of the key information about your environment in a single pane of glass, using dashboards, maps and charts to combine multiple data sets.
With dynamic charting, the ability to build and share custom dashboards in minutes, and a robust RESTful API for visualizing NMIS data and more, opCharts allows networking teams to see any level of detail, map every server across the world to a building, floor, server room or rack.
-
opCharts Data Sheet
Features
Actionable Dashboards
Actionable Insights for Proactive Teams
OpCharts combines and sorts devices into dynamic groups through user-defined metadata, providing key performance metrics at every level.
With opCharts, you get the best of both worlds. Dashboards provide high-level abstracted user views while allowing you to drill down into detailed performance metrics quickly. This fast access to information is a game-changer for efficient network monitoring.
Business Data & Controls
Dynamic Data Display with Granular User Roles
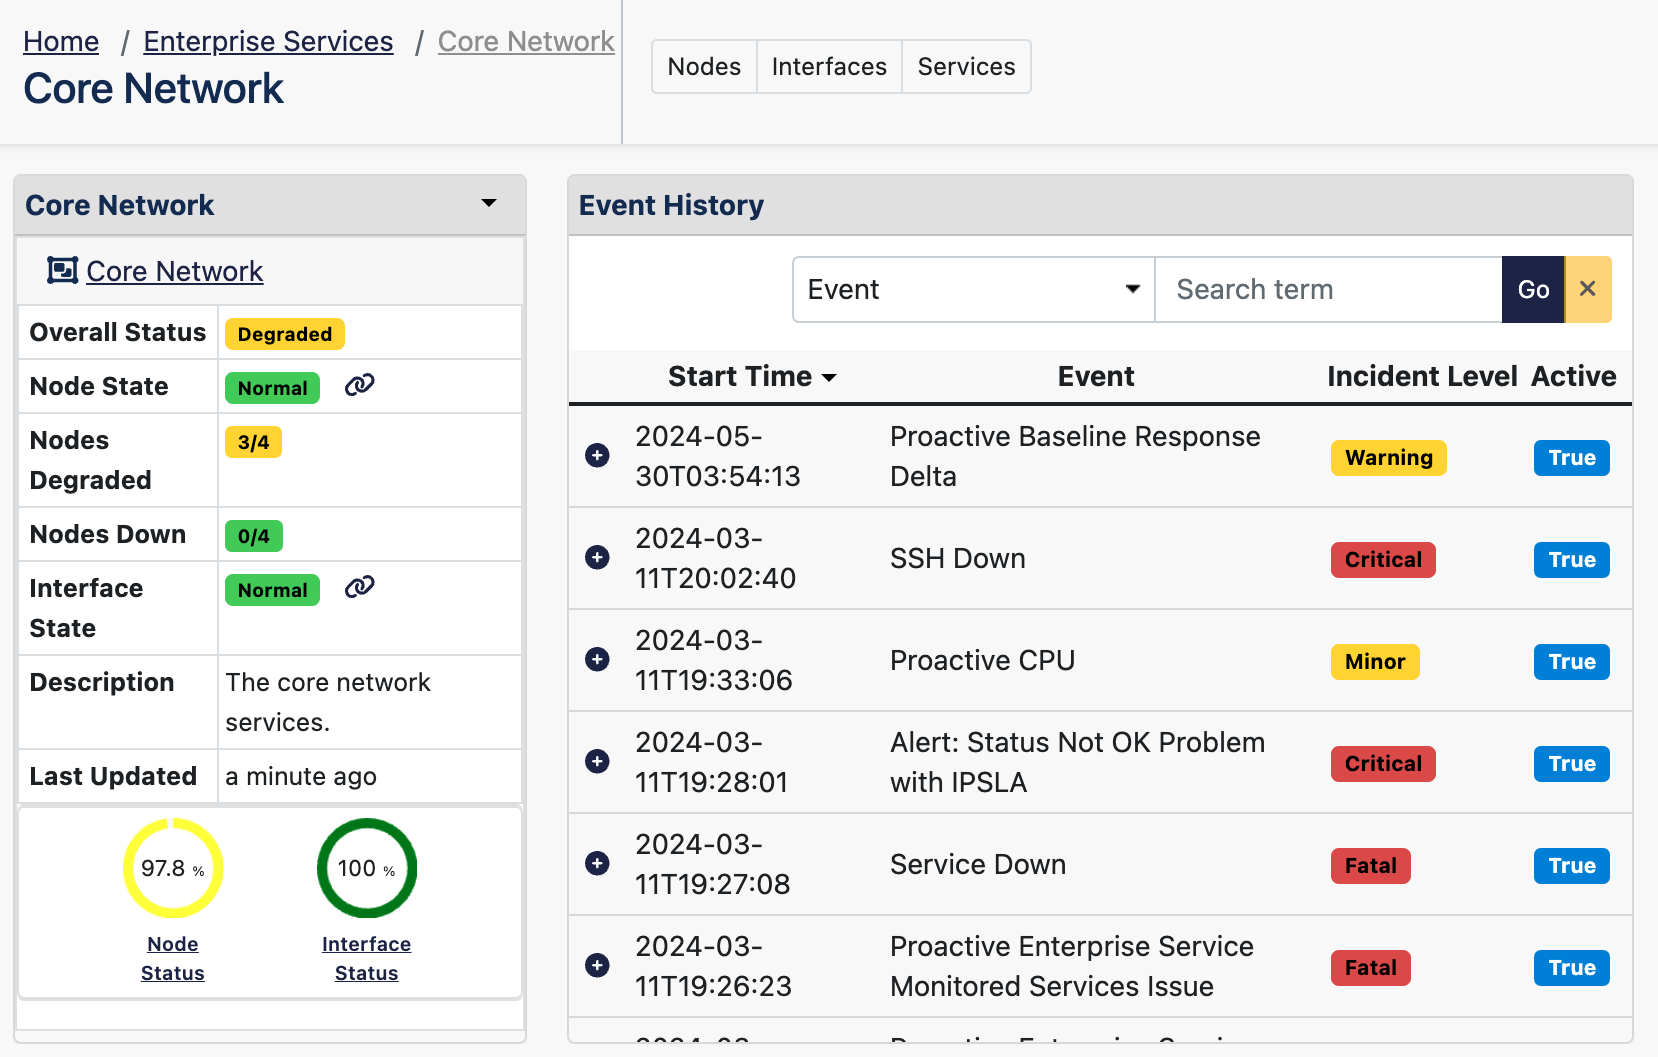
Developed to display large amounts of data through a dynamically responsive interface, opCharts lets users see all systems’ live state and history on the same page.
With granular user roles and authorization permissions, networking monitoring teams can share the data across their organization or with third-party vendors.
Visualise Everything
Search and Find What You Need Instantly.
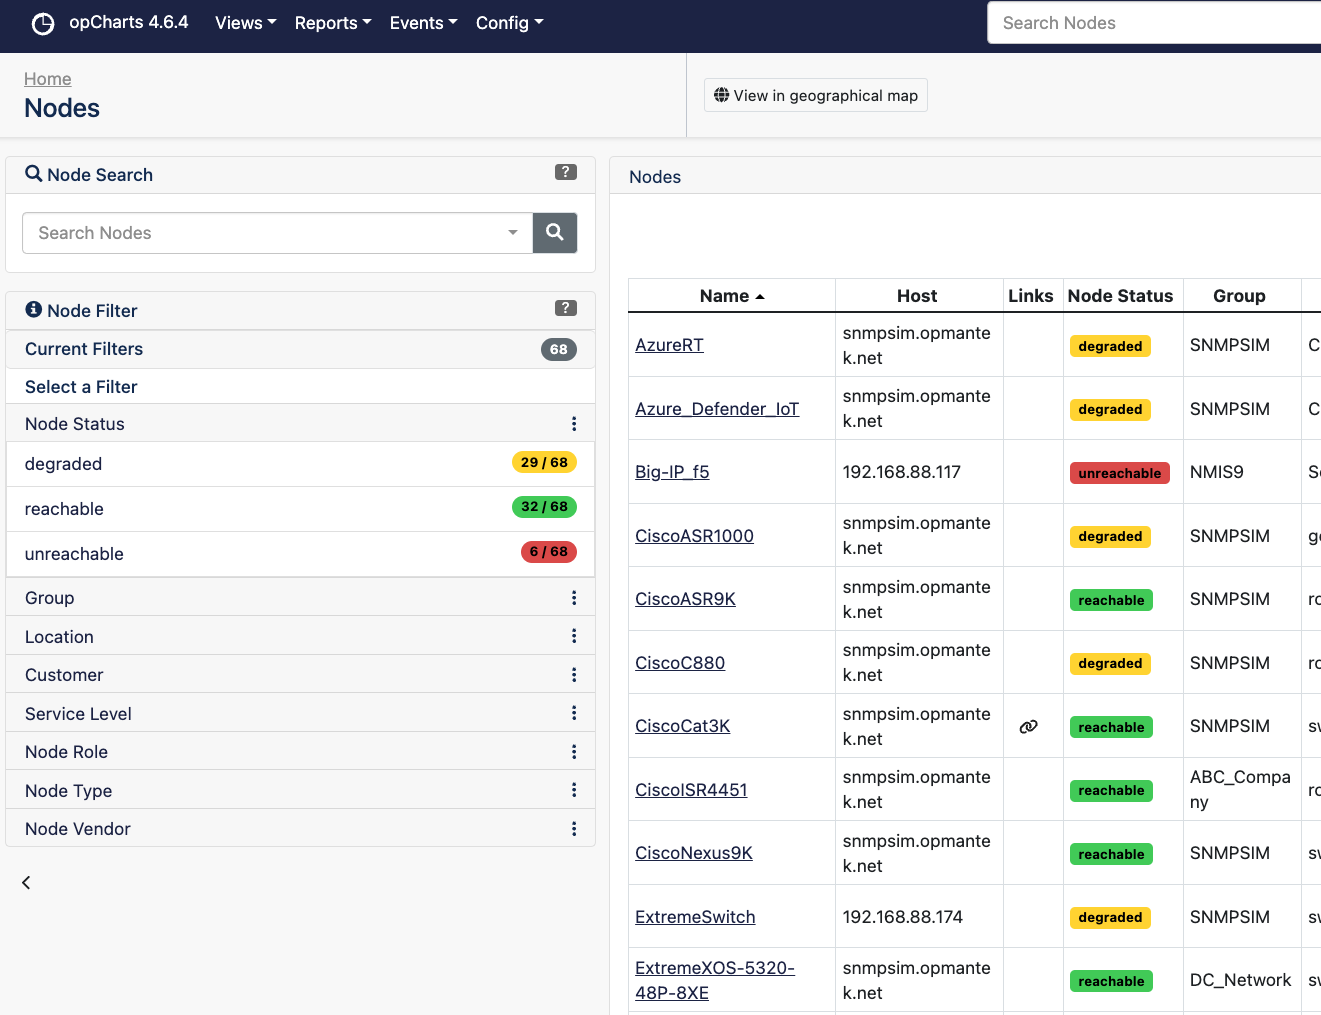
Find any device, anywhere quickly. Using the opCharts schema-driven engine, teams can filter and group your inventory across any logical or physical attribute.
The RESTful API enables teams to integrate any third-party data directly into opCharts, offering unparalleled flexibility and access.
How it Works
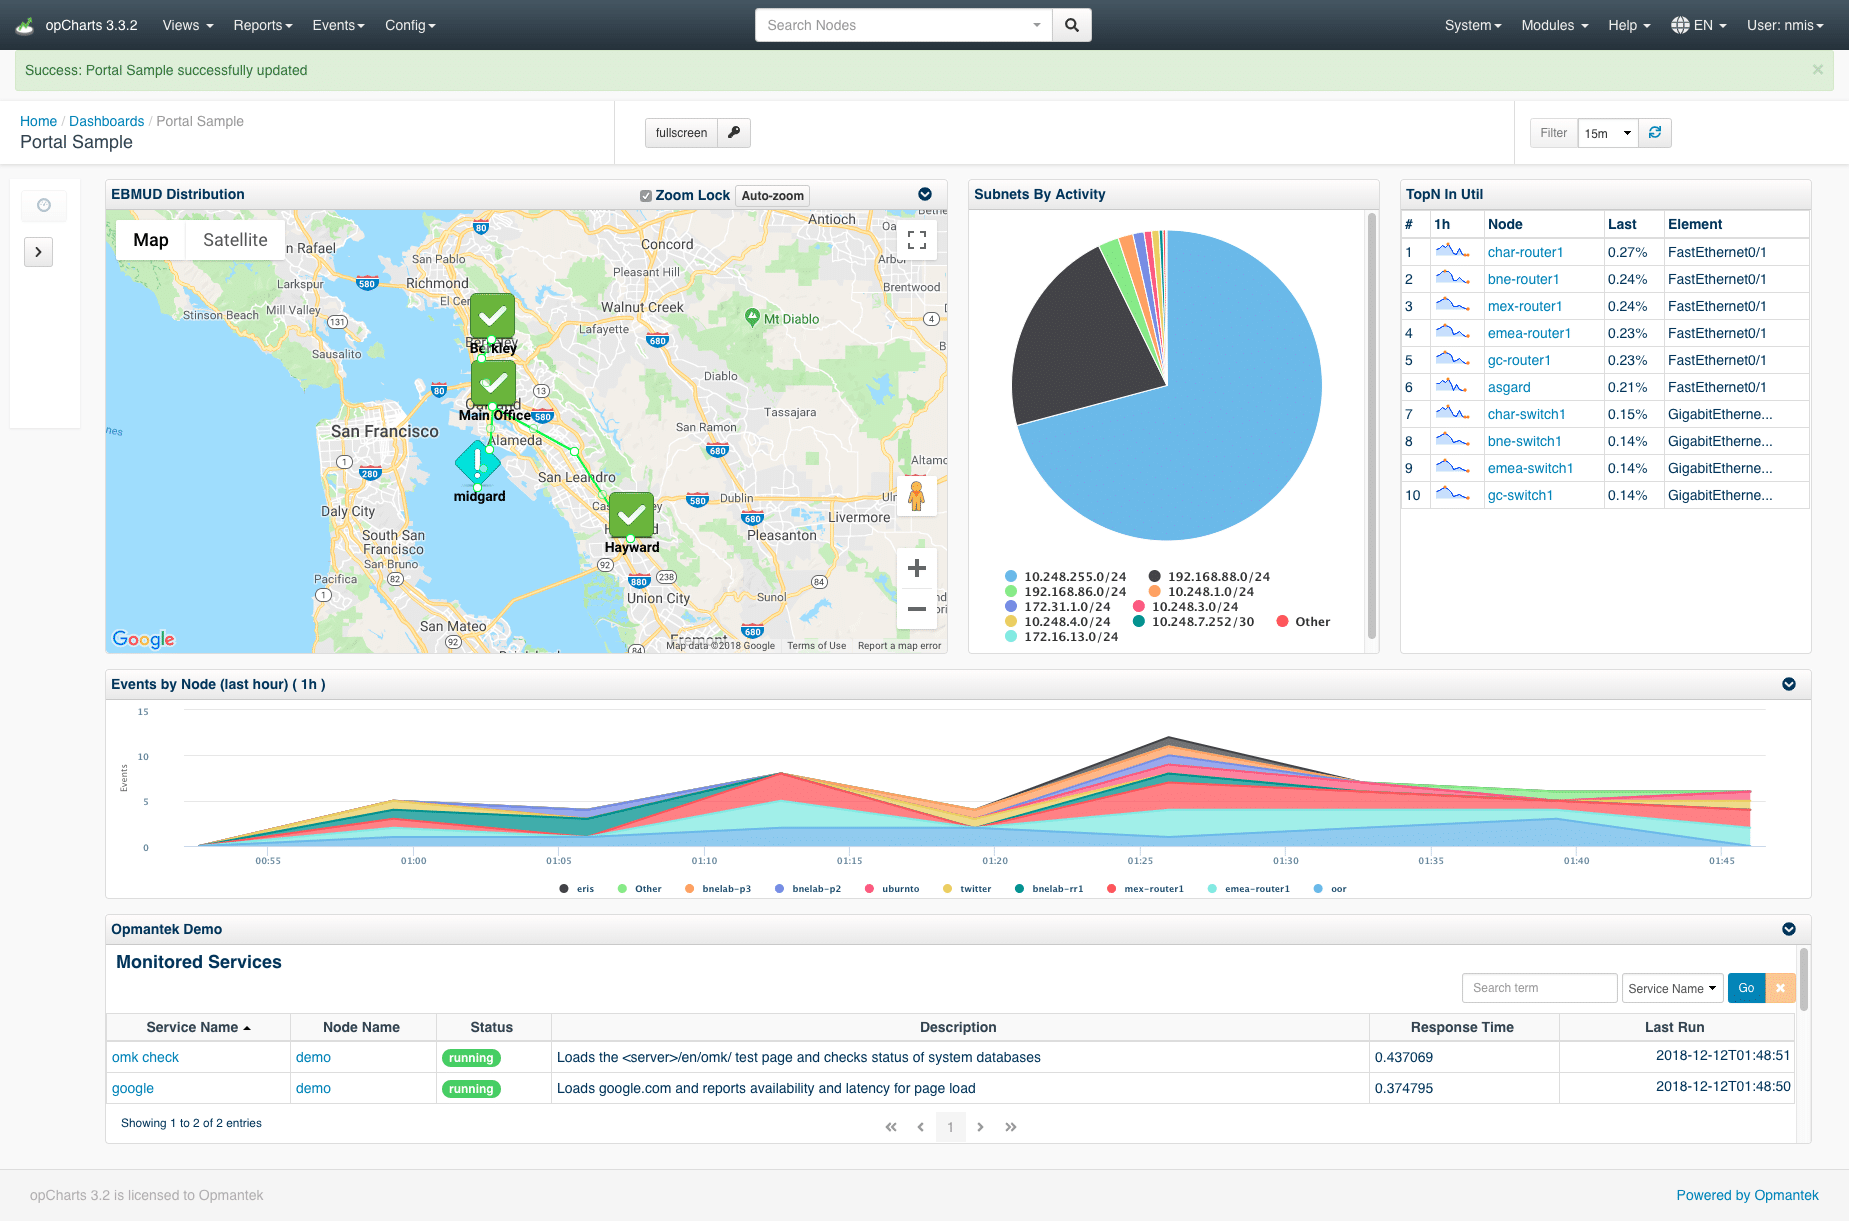
opCharts gathers data from network devices and other FirstWave network modules, aggregating it into a centralized system for visualization. Users can customize dashboards to display the specific data they need, such as device status, network traffic, and performance metrics.
Real-time data monitoring ensures that users have up-to-date information on network health, while historical data storage allows for comprehensive trend analysis.
🚀 Download for Free
Jump straight into managing your network