02 March 2018
Monitoring Business Services

In ITIC’s 2016 survey 98% of respondents indicated a single hour of network downtime costs them over $100,000, while 81% of Enterprises reported hourly outage costs exceeding $300,000, and 33% reporting losses in excess of $1-5 million/hour. When we talk network downtown we’re really referring to application and business service availability – is the software the business relies on operating within acceptable norms of responsiveness and accuracy?
Gone are the days when engineers could simply wait for an end-user to phone in a performance problem. Networks are far too complex, with multiple layers of redundancy and fail over, for the focus to be on the individual parts – a manager once told me, “it’s not the equipment that make the money, it’s what the equipment enables us do that gets everyone paid.” With potential losses of 5MM/hr it is crucial network teams have the tools in place to handle performance and fault monitoring, automate event handling, and roll-up individual device state and service status into more complex application and business service profiles.
You can visualize application and business service monitoring as a multi-layer problem; a pyramid of pieces. At the very bottom, the wide base of the pyramid, are all the individual parts, or widgets, that represent the components of the service. These are the servers, storage devices, switches, and load balancers that the application relies on for hosting and operation. But that base layer is also comprised of the specific key interfaces data flows through as well as the services each server hosts that the application needs – like the mysql or apache daemon. Above that layer are the components that comprise the entry user experience (UX); does the application’s login page load in a reasonable time? Finally, at the top-end of the pyramid is an end-to-end exercise of the application itself. Usually referred to as a synthetic transaction, this is about ensuring the entire application works from presentation, to business logic, and back-end layer.
The chart below displays the results of just such a test. The black line represents the state of the synthetic transaction, while the yellow line shows how long it takes to execute the synthetic transaction and get a result back. You can see where the black line dips that the synthetic transaction failed during that period, but since the yellow line was still drawing something came back, just not the expected result.
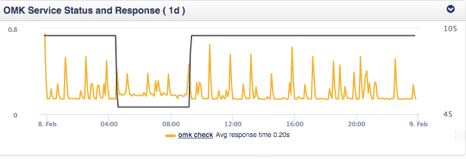
Each of these parameters can be thresholded, with escalation rules, and alarms assigned quickly and reliably using Opmantek’s Network Monitoring Information System (NMIS) Solution for performance and fault monitoring. Expanding NMIS with opCharts allows the creation of detailed application centric dashboards containing easily interpreted charts, like the one above.
Demands placed on the Network Operations Center increases exponentially as the Lines of Businesses they server become more dependent on applications and their frameworks to generate revenue. Tools like Opmantek’s NMIS, opCharts, and others can help engineers quickly and efficiently go from a high, abstracted view of the application down to a root cause, automating collection of troubleshooting information and even self-heal the network.
For more information on Opmantek’s Discovery and Asset Auditing, Performance and Fault Monitoring, Configuration and Compliance Solutions, or to schedule a demonstration, please visit our website at www.opmantek.com or email us at contact@opmantek.com.
Paul McClendon | Software Support
Desk: 1(704)909-2829
paulm@opmantek.com