As the world becomes more and more connected telecommunications, internet, and managed service providers must compete with one another to provide the fastest, most affordable, and cutting-edge services.
Traditionally these industries have been heavily laden with rules, requirements, and regulations that have resulted in large volumes of manual operational processes focused towards managing data, controlling cost and business efficiency, and developing new services. Adhering to these processes can be so time-consuming that it prevents these service providers from focusing on the most critical aspect of their business: their customers.
In recent years, however, technologies have evolved to a point that networks can now be more digital and as a result, more dynamic, flexible, and customisable. The use of Robotic Process Automation can make systems intelligent and more automated, enabling predictive and near-real-time actions. These systems, when coupled with an agile management model, can have a massive impact on response times, time to root cause, and preventative remediation reducing costs while improving customer experience.
What Is RPA?
Robotic Process Automation (RPA) is the integration of artificial intelligence and machine learning abilities into a computer or robot, to carry out repetitive tasks, manipulate data and communicate with digital systems in order to improve efficiency and performance.
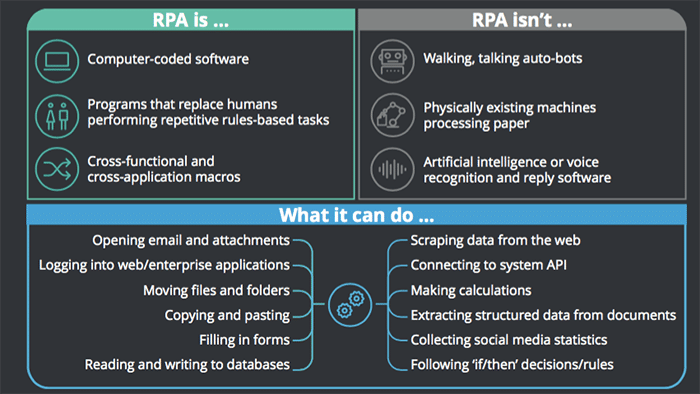
Image Source: Deloitte
RPA Adoption In Numbers
In September 2017, Deloitte invited organisations globally to take part in an online survey on their use of RPA. They received responses from over 400 organizations across many industries with a combined value of $1.8 trillion. The information was then analysed and published in a 2018 report titled “The robots are ready. Are you? Untapped advantage in your digital workforce.”
The report revealed the massive extent to which organisations are using RPA to improve business efficiencies. RPA projects consistently outperformed expectations on non-financial benefits such as accuracy, timelines, flexibility, and improved compliance, with at least 85% of respondents reporting that RPA met or exceeded their expectations in these areas. In addition, a total of 61% reported their expectations of cost reduction were being met or exceeded. Some highlighted the fact that this enabled them to move people from performing transactional tasks to higher-value activities that also led to greater job satisfaction.
Expectations were also exceeded when it came to the FTE capacity that could be provided by robots. Most organisations in implementing RPA forecast it could replace around 20% of existing human tasks. In fact, those that have scaled RPA appear to have had such a positive experience that their expectations are even more ambitious: they believe that 52% of FTE capacity could be provided by robots. This can enable the human workforce to be redeployed to more value-adding activities.
“RPA augments what our people do: it supplements their capability, it means that they can focus on things that are more value added, that are more interesting.” Shared Services Director, Multinational building-materials company
RPA – A Telco’s Best Friend
In the managed IT Services and Telecommunications industries, RPA is being rapidly adopted as a key strategy to help with enterprise planning to improve networks, including changes to performance management, network design, and network digitization.
Software providers such as Opmantek recognised early the opportunity for Managed Service Providers, Telcos and even centralised IT departments to utilise RPA to leverage the volumes of network data their monitoring systems were collecting to drive operational insights (predictive analytics) and to increase impact from this data significantly by combining it with Cognitive Automation – applying machine learning techniques to automate responses to trends and anomalies, based on the laws of probabilities.
Across some of the worlds largest and most complex telecommunications and enterprise networks, the sentiments and improvements recorded company-wide in the Deloitte survey are similarly reflected in the cost savings, service improvements and reassignment of skilled engineers from repetitive, mundane tasks to more specialised and impactful areas of the business.
For these service providers, the operational tasks of IT teams have altered significantly, with RPA taking care of procedural and budgetary adherence and human resources now able to focus on every business’ top priority: customers.
Start exploring how RPA will work in your organisation by downloading the Opmantek Virtual Machine today and activating your free license for up to 20 devices. If you would prefer to have an engineer walk you through the software, fill out the form below.