opCharts 3.2.7 New Release
2018-05-08 18:28:51
Here at Opmantek, we take pride in how efficiently and effective jobs can be accomplished. Sometimes we even surprise ourselves. The latest release of opCharts was originally planned to be a maintenance release only, but our development team wanted to go above and beyond and they have implemented some new features to make life easier for everyone.
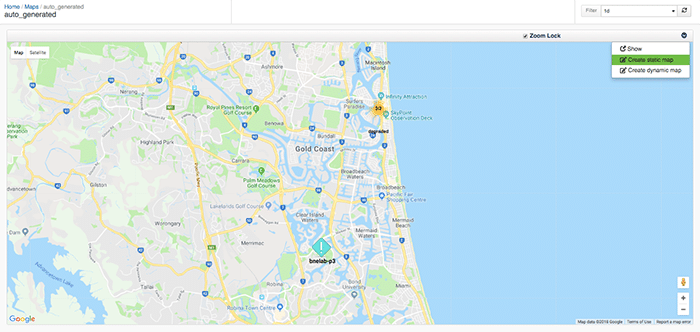
Inside the node list view, you can select the filters that you desire and then view the filtered results in a geographical map. You can then save this filtered map in a static or dynamic manner. The static map will display the nodes that are currently displaying upon each load, the dynamic map will save the filter and add/remove nodes on each full page refresh.
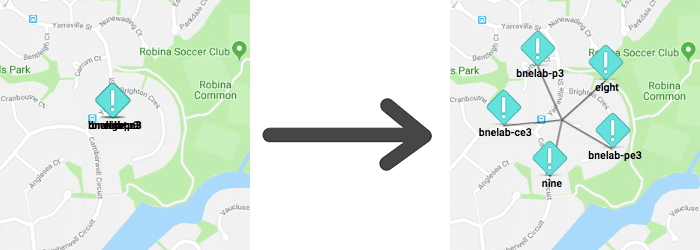
Further, the maps have become easier to read, when there are multiple nodes in a single location if you click the icon, the nodes will fan into a more readable format. See below for the before click view and after click view.
If you have any feature requests don’t hesitate to reach out, we value your opinion and love to fulfil customer requests.