Network Discovery, Auditing, and Compliance: A Complete Guide - FirstWave

Network Discovery, Auditing, and Compliance: A Complete Guide

Learn how these essential processes work, why they matter, and how you can use them to improve your network management.

The networking landscape of the future will be more complex to navigate than ever before. The global cost of cybercrime is estimated to reach 15.63 trillion U.S. dollars in 2029, following a continuous increase over the prior 16 years. Global data creation is set to reach more than 180 zettabytes in 2025, up from 64.2 zettabytes in 2020. And the proliferation of AI is unavoidable – according to Gartner, “by 2029, 10% of global boards will use AI guidance to challenge executive decisions that are material to their business.”

To keep ahead of these trends and prevent negative impacts to their bottom line, effective network management is essential – and taking proactive steps to achieve and maintain network compliance will become more critical than ever. But how do you achieve effective network management if you don’t know which assets are on your network?

Network discovery and auditing play a key role in achieving compliance, fortifying security, increasing operational resilience, and ensuring business continuity. The repository of information you gather from automating your discovery and auditing provides what is known as a Network Source of Truth (NSoT) – a central data repository you can use to effectively manage and configure your entire network.

In this complete guide to discovery, auditing, and compliance, we’ll review the key functions of network discovery and auditing, how they work together to achieve compliance, and why you should use a tool like Open-AudIT for these processes.

Table of Contents

What is network discovery?

Discovery is your foundation to achieving compliance and effectively managing your network. Network discovery simply refers to the process of identifying all devices and components connected to your business network, creating a comprehensive inventory of assets including hardware devices, software applications, and services.

Network discovery typically involves various methods like running scripts (like Python, Powershell, or Bash) and sending ping requests, SNMP queries, or port scans to detect and examine network components. As a result, teams can collect data on device types, versions, connections, access controls, usage patterns, and more.

Performing regular network discovery pulls back the curtain to offer network teams several capabilities they didn’t have before:

  • Achieve compliance: Access to regularly updated and recorded network inventory is the first step to maintaining compliance with industry regulations and standards (more on this soon).
  • Effectively allocate resources: Optimize network performance and costs by identifying underutilized resources and balancing resource allocation.
  • Keep devices up to date: Ensure each network device has the latest software and device versions to patch vulnerabilities and protect data from end to end.
  • Asset management: Get a comprehensive inventory of all network devices, applications, and services, enabling better asset tracking and management. This includes end-of-life hardware, operating systems, and software, as well as greenfield and brownfield devices.
  • Security monitoring: By identifying unauthorized devices or unwanted user permissions through methods like firewall service monitoring and Windows security dashboards, network discovery enhances network security and prevents cyberthreats
  • Troubleshooting: With a detailed map of the network topology and connected devices, administrators can more easily diagnose, resolve, and prevent network issues.

Network discovery is a fundamental process that equips IT professionals with a comprehensive understanding of their network infrastructure, enabling them to manage, secure, and optimize their networks more effectively through auditing.

What is network auditing?

While discovery simply “finds” what’s on your network, auditing is the process of interrogating this information to evaluate and assess the security, performance, and compliance of your network. Teams can do this by filtering their discoveries using custom parameters to explore almost anything they could want to know.

Network audits produce reports which can (and should) be kept for business records; they can also be used to track changes in your network over time. The information collected in discovery can be used to generate audit reports like:

  • Asset inventory snapshot: Record a comprehensive list of network-connected devices, systems, and assets including servers, routers, switches, printers, IoT devices, and end-user devices like employee workstations.
  • Network topology map: See how devices on your network are connected to each other.
  • Device configuration: Capture the configuration details of network devices like firewalls, switches, and routers, and track configuration changes over time.
  • Access control: Check user permissions and access levels across your devices and software to manage internal threats.
  • Security vulnerabilities: Find outdated software, open ports, weak passwords, or insecure protocols such as Telnet.
  • Traffic and bandwidth usage: Check bandwidth usage across different parts of the network and identify congestion points.
  • Compliance status report: Check your network’s compliance against industry regulations or standards like GDPR, HIPAA, or PCI-DSS, ACSC Essential Eight, or CIS.

Conducting regular network audits is crucial for business continuity as it helps organizations maintain a secure and compliant network infrastructure. By identifying and addressing potential issues proactively, you can mitigate risks, prevent data breaches, and avoid costly downtime or regulatory penalties.

What is network compliance?

While there are plenty of other benefits to managing your network through effective discovery and auditing, network compliance is the main reason you should do so.

Achieving network compliance means adhering to relevant regulations and standards that maintain data integrity, privacy, and security, among other things. Compliance is a non-negotiable part of network management, and the trust of customers, investors, and partners can hinge on an organization’s ability to meet their industry’s regulatory standards.

Organizations should remain vigilant about their compliance to meet legal and regulatory requirements, avoiding hefty fines and reputational damage. The regulatory frameworks your organization is required to comply with (if any) depend on your industry and region/s of operation, and will almost always include data security measures.

You may have internal regulations to consider, too – for example, perhaps you work for an enterprise that also enforces its own set of data privacy rules.

Using network discovery and auditing, businesses can achieve compliance by:

  1. Identifying applicable regulations based on the organization’s industry, location, and data handling practices.
  2. Conducting regular network audits that identify potential vulnerabilities and areas of non-compliance in accordance with these regulations.
  3. Implementing security controls and fixes to address identified risks and stay compliant with relevant regulations.
  4. Continuously monitoring the network for compliance violations and security incidents.
  5. Producing compliance status reports that check against industry regulations and that serve as a record for compliance verification.
  6. Maintaining detailed documentation and audit trails over time for change tracking and compliance audits.

How discovery, auditing, and compliance work together

Each of these processes strengthens the others: discoveries provide visibility, audits assess security and compliance, and together, they enable organizations to maintain compliance in a structured, thorough way. Network compliance, in turn, relies on accurate discovery data to ensure accurate audits and ongoing alignment with security policies.

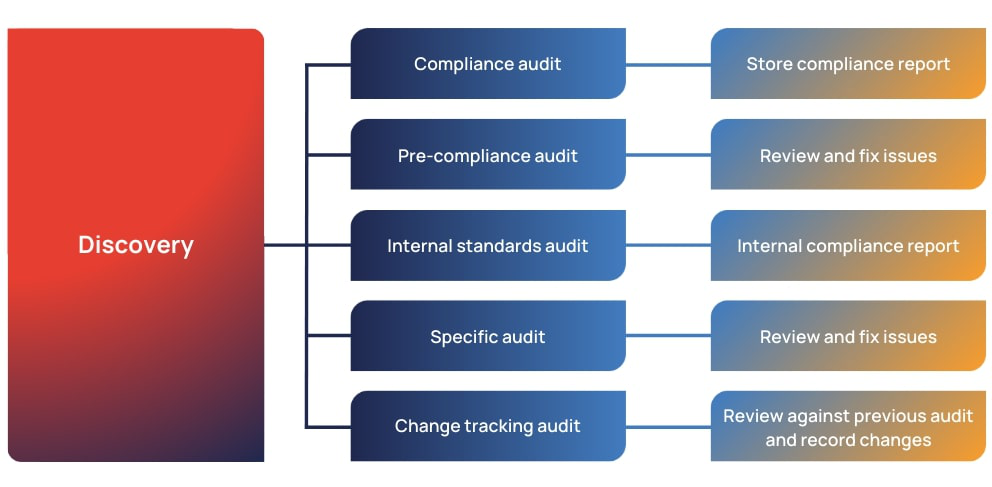
When you run a network discovery, you can run several audits from that discovery for the purposes of:

  • Storing compliance reports
  • Reviewing and fixing issues to maintain compliance
  • Checking against internal standards
  • Tracking changes over time
  • Focusing on a specific part of your network, like bandwidth distribution or hardware warranty status.
Discovery, Auditing, Compliance Process Diagram - FirstWave

Why discovery, auditing, and compliance matter

Would you trust a healthcare provider that wasn’t HIPAA-compliant, a utilities provider that wasn’t NERC-compliant, or a bank that wasn’t PCI DSS-compliant? Would you just hope your personal data was safe and these services didn’t go down, or would you take your business somewhere else?

As networks grow more complex, the processes of discovery and auditing are the ultimate way to not just achieve compliance, but also achieve a profitable business.

Every organization should take compliance seriously, as failure to achieve it can result in:

  • Costly fines from regulators
  • Legal liabilities, including potential lawsuits
  • Long-term reputational damage
  • Increased government scrutiny
  • Interrupted business operations
  • Loss of trust from customers and investors.

On a broader level, the consequences of not managing your network can also lead to:

  • Cyberattacks from network vulnerabilities, outdated software and devices, or unauthorized network access
  • Ballooning costs due to unchecked network inefficiencies
  • Performance issues due to lack of visibility over usage patterns, traffic, and bandwidth
  • Poor resource allocation, leading to bottlenecks and underutilized resources
  • Difficulty diagnosing and resolving network issues, increasing mean time to resolution and causing downtime, latency, jitter, and impaired user experience
  • Challenges managing and integrating your network as you add service providers, locations, and automations over time.

There’s no need for your team to perform manual discoveries and audits. In fact, we advise against it – manual audits are prone to oversights and inconsistencies, and can be incredibly time-consuming.

Instead, automating network discovery processes with a tool is an easy way to provide your business with a NSoT. A NSoT allows you to check and validate your network performance and take complete control of your network management.

As a result you’ll save time and resources, improve reliability, and allow for proactive issue resolution. This efficiency boost has a ripple effect across your entire organization, reducing operational hiccups, minimizing downtime, and speeding up time to market.

You can automate and customize your network discoveries to make sure nothing is missed by using a purpose-built tool.

Discovery, auditing, and compliance tools

Effective network management requires a tool that can integrate with your network, scan for devices, store configurations and other information, and generate insights for auditing and decision-making.

You can ensure you choose the best tool for your organization by checking it offers:

  • the ability to run scheduled and unscheduled discoveries
  • information displayed in a detailed, customizable dashboard
  • extensive vendor support
  • multiple different audit report options
  • integration with existing infrastructure and security solutions
  • the option to audit against industry benchmarks for easy compliance.

These features give you the ability to keep your network compliant with minimal effort, as well as the flexibility to effectively manage your network as it becomes more complex.

Achieve network compliance with Open-AudIT

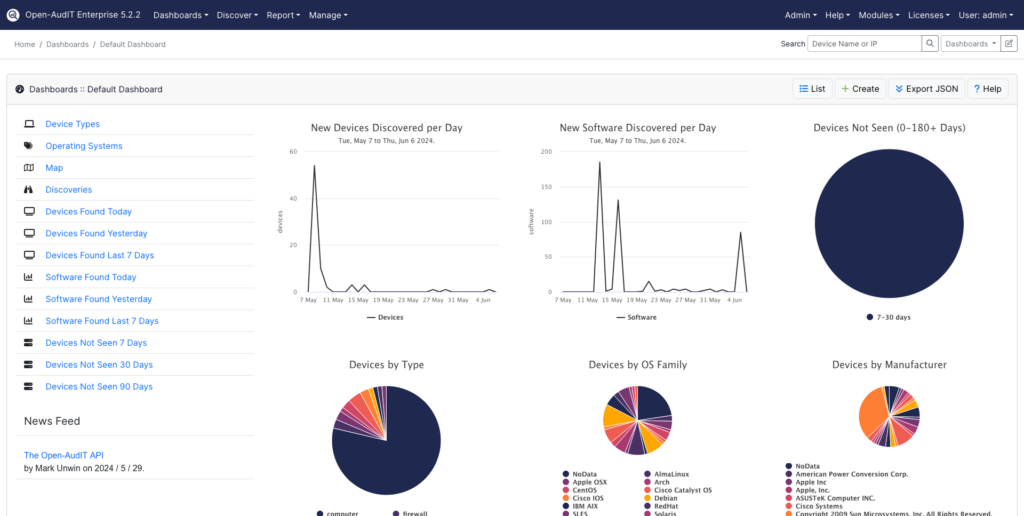
With intelligent discovery, auditing, and compliance features, FirstWave’s Open-AudIT gives you complete and cost-effective visibility and control of your network, enabling you to manage your assets and achieve compliance effortlessly. Plus, with the Community Edition, it’s free to get started (with the option to purchase additional functionality).
Device Discovery Open AudIT - FirstWave

When you use Open-AudIT, you’ll get features like:

  • Accurate device discovery: Run automated or unscheduled discoveries, including SSH and SNMPv3, to get detailed records on all network-connected devices. Dive deeper with the ability to filter for devices within certain parameters (for example, within an IP address range).
  • Complete coverage: Set up local collectors on air-gapped parts of your network or across different geographic locations, so you don’t miss a thing.
  • Detailed dashboards: Explore anything you could want to know about your network with Open-AudIT’s extensive dashboards, giving you the ability to visualize your discovery data any way you like.
  • Extensive reporting: Filter and export discovery data to more than 80 different types of reports, making it easy to scrutinize devices, user permissions, software and hardware versions, connection information, and much more.
  • Benchmark standards and policies: If you use Open-AudIT Enterprise, you can easily achieve compliance with custom benchmarks. Choose from our long list of included industry standards or set custom benchmarks based on your organization’s own security policies.
  • Seed discoveries: Get a complete snapshot of your network by running a seed discovery—a sequence of discoveries run from a single “seed” router to build an extensive picture of every device on your network—to get a thorough bird’s-eye view.
  • Shadow IT protection: Open-AudIT helps you identify unauthorized devices or malicious activities on your network, known as shadow IT, through continuous network monitoring. Plus, if your organization has blacklisted software, you can customize Open-AudIT to notify you if this software is discovered.
  • Change tracking: Open-AudIT tracks changes to specific device attributes, including installed software, hardware, and settings, so you can easily audit changes over time.
  • Role-based access control (RBAC): Get granular control over user permissions to filter and limit access to sensitive network data, reducing the risk of insider threats.

Install Open-AudIT in under 10 minutes with our quick guide.

Unlike most competitors, FirstWave’s agile team of development experts use their deep industry knowledge to offer each customer hands-on support for all FirstWave solutions.

Effective network management through discovery, auditing, and compliance is crucial for business success. Open-AudIT provides these capabilities in a user-friendly, comprehensive platform that will grow with your business.
Ways You Can Manage Your IoT System Using Network Management Software

Table of Contents

Internet of Things Systems and Applications

The use of Internet of Things (IoT) technologies is increasing, largely driven by the value seen by organizations in the application of these technologies to reduce costs, access more information, improve actionable insights, reduce downtime, improve customer experience, better manage risk, create new revenue streams, and much more. For many organizations, new applications of IoT are compelling; many organizations already use IoT and are looking to integrate IoT into their existing production network.

Enterprise Management Associates (EMA) research paper titled “Network Management Megatrends 2022: Navigating Multi-Cloud, IoT, and NetDevOps During a Labor Shortage, April 2022” indicated that of those organizations represented in the research, 96% were expecting to or were already connecting IoT devices to the corporate network. All the companies were making significant investments in networking and network monitoring technologies to handle increased demand for IoT.

For many people who have worked in IT, especially in networking for a while, IoT isn’t that new. The IP and storage networks, server clusters, mobile devices, etc., are smart devices that make data available to verify their operation. IT professionals have been using data to improve outcomes for decades.

However, IoT is a bit different. The use cases and IoT applications differ from traditional use cases and applications. Typically, IoT applications have a fundamentally different purpose and operate differently than traditional applications. The focus is on obtaining the necessary data and making it available for reporting, dashboards, real-time alerting, and longer-term analytics, including AI/ML.

IoT Use Cases

It’s virtually impossible to list all the types of IoT systems in use today, and new ones are emerging all the time. Manufacturing, logistics, retail, health, and many other sectors have been using IoT technologies for years. As sensors and networks become more robust and cheaper to produce and maintain, more use cases will arise. Here are some of the interesting ones encountered recently:

  • Mine vehicle air quality
  • Remote weather stations, including lightning strikes
  • Soil moisture monitoring
  • Livestock water trough monitors
  • Moisture detection in buildings

Traditional Enterprise Applications

A traditional enterprise application would include a user accessing an application via their PC/mobile. This application likely has a frontend, application logic, and a database. It could be running on one or more servers or using microservices, containers, and databases. This could be a SaaS offering or could be hosted in the organization’s data center.

Typically, in an enterprise application, data is created by users (data entry). Users will also view the data for reporting, analysis, and to support business processes.

IoT Applications

In an IoT system, you’ll find collectors/sensors, the network/transport, and an application that processes all the data and provides a user interface for users to access the data.

The differences between a traditional and IoT application include:

  • The network may not be end-to-end IP
  • No data entry by users

In a non-IP IoT application, a device sends packets over a network to a backend application for processing. The network may NOT be IP. Communication is often one-way; polling devices isn’t possible. Eventually, packets are sent over IP and reach the servers used by the IoT application. Users aren’t involved in data entry; they access the IoT application for dashboards, analytics, etc.

Types of IoT Systems

Now that we’ve established we can monitor and manage an IoT system, how should we categorize them? The following are the main four types of IoT systems we see:

Name Description
Smart IoT Full stack OS with SNMP agent or native API and an IP address
IoT over IP Semi-smart device hardwired to talk to Cloud Server
IoT over mobile Roaming low power cellular devices using 3G/4G
IoT over low energy network End devices use a low energy network (LoRaWAN, Bluetooth, Zigbee, etc.) to a gateway which then sends IP packets

To collect data from an IoT System, we can further categorize how and where we’ll get the data. The following methods are possible:

Method Description
Bi-directional comms If the system uses Native IP, bi-directional communication with the end things is possible
Direct Polling Direct communication with the end device is possible, at a minimum sending a protocol “ping”, e.g., ICMP packet
Application Polling Determine the status of the end device and request metric data using a request or query to the application, e.g., an API request
Events or Messaging The device communicates by sending events or messages, this could be syslog, streaming telemetry, MQTT, or another message bus. An intermediate gateway could translate messages into an IP packet

Monitoring IoT Systems

We can now compare the types of IoT devices to the methods available to determine the best way to monitor the device:

Name Native IP Bi-directional comms Direct Polling Application Polling Events or Messaging
Smart IoT Yes Yes Yes N/A Yes
IoT over IP Yes No No Yes Likely
IoT over mobile No No No Yes Likely
IoT over low energy network No No No Yes Likely

This is a summary of how various IoT systems work, and there are many more variations, but most will fit this model. For example, many home IoT devices use IP but only communicate with the cloud application. It’s not possible to make local requests for data, while other home IoT devices support both.

The result is that NMIS can get data directly from the IoT device or from the IoT application, or it can listen for events using opEvents. If NMIS doesn’t already support your IoT application, it can be easily adapted using the modeling system and/or plugins.

Managing Things with NMIS

Now that we’ve identified the types of devices NMIS can manage, we can determine the best way to manage each of them in NMIS.

Smart IoT – Smart Cameras

Getting data from Smart IoT devices with NMIS is straightforward. The best option is to use SNMP to collect the data and have the device configured to send any SNMP traps and/or syslog to the NMIS server.

For example, while working with a large enterprise in the USA, the implementation team in the US assisted with the creation of an NMIS model that collected data from the Axis security cameras in use.

The focus of this work was to ensure all cameras were online and functioning. The goals for the IoT monitoring included:

  • ICMP Ping to confirm reachability, packet loss, and response time of the devices
  • sysUpTime poll to detect “Node Reboot”
  • Current OS version
  • Video Signal Status
  • Traffic transmitted and received by the camera
  • HTTP/HTTPS service/server operating and returning data
  • Storage status (storage disruption detected)
  • Temperature sensors

AXIS provides a public MIB file, which you can download here.

With access to a camera and the MIB file, it’s straightforward to complete the NMIS model and have NMIS collect this data.

Because of the proprietary nature of this work, these models haven’t been released publicly. If you’re interested in monitoring AXIS cameras, please contact the FirstWave team.

Monitoring Weather with IoT Over IP to the Cloud

IoT sensors provide many benefits by increasing available data and the amount of information and knowledge that can be derived. Monitoring the weather offers several advantages, including the ability to correlate weather events with network events. These events could be correlated by opEvents and provide the true root cause of outages.

Netatmo produces a robust solution for weather monitoring. This is consumer-grade but suitable for businesses to monitor the weather at any location they choose. The principles applied with Netatmo would work equally well with other cloud-based IoT solutions, whether they’re for weather or another IoT sensor.

The result is that you can see the weather information for that location in opCharts and NMIS and include it in any dashboards you require.

The flow of data is that the sensor collects the weather data and uploads it to the Netatmo servers on their backend. NMIS then polls the Netatmo API periodically to collect the needed weather metrics.

Once you sign up for a Netatmo developer account, you can create your credentials and API keys, then set up a model and plugin to collect the data. The flow of data in NMIS looks like this:

The Netatmo plugin is available on GitHub.

The Netatmo plugin provides an example of how to structure your model and plugin, including necessary configuration information. This example uses an IoT over IP system, but this method would work equally well with:

  • IoT over mobile
  • IoT over low energy network

With this example, you should be able to create your own plugin to talk to an IoT over IP device. Equally, the FirstWave team would be happy to assist you in getting visibility of your IoT system.

Network Devices with Controllers or Element Managers

There are many products available now that connect to the IP network and may be locally managed, but the technology solution includes a controller. Examples include:

  • Wireless access points
  • SDN WAN Routers
  • Other SDN solutions
  • Transmission networks with Element managers

While we don’t consider these technologies IoT, they work similarly. Depending on the technology, the solution would be like Smart IoT or IoT over IP, while transmission networks using Element managers would be like IoT over mobile.

NMIS already includes support for many vendors like these. For more information, contact your FirstWave representative.

Wrapping up

Now we have some definitions for the types of IoT applications and how we can communicate with the application.

Establish which type of IoT application it is:

  • Smart IoT
  • IoT over IP
  • IoT over mobile
  • IoT over low energy network

Then we determine how we can collect the data:

  • Bi-directional comms
  • Direct Polling
  • Application Polling
  • Events or Messaging

With this information, when we need to monitor an IoT application, we can classify it, understand what’s involved in getting NMIS to collect the data, and make it happen.

Learn More

To find more information about the various features and capabilities in NMIS relevant to what has been discussed, check out the following pages:

Finding Devices With Custom Queries in Open-AudIT

When considering what a typical network is and what is monitored in it, a few devices usually come to mind; Switches, Routers, HUBs, etc. With the advent of the Internet of Things (IoT) the variety of monitored devices is increasing even further, adding IoT devices such as thermostats along with the devices that regulate them (Microcontrollers, Single-Board-Computers, etc.). 

Without having inventory management software, it becomes challenging to keep track of where and what devices are on your network. Opmantek’s Open-AudIT software not only provides in-depth network auditing; it is also easy to create custom queries with this information. These queries allow you to find and organize devices in whatever manner you or your team find best.

Open-AudIT used as a configuration management database system (one of its many uses) ships with 33 pre-built queries to assist in finding and organizing devices. These queries range from what memory and processors are used, what software is currently installed, to what IP addresses are consumed on the network. 

Understanding that no two networks or organizations are alike, there is a need to have the ability to customize queries to fit your team’s needs. Open-AudIT accomplishes this through the use of Custom Queries. A query is essentially a SQL statement that runs against the database to only display the requested filtered items the user has permission to view. 

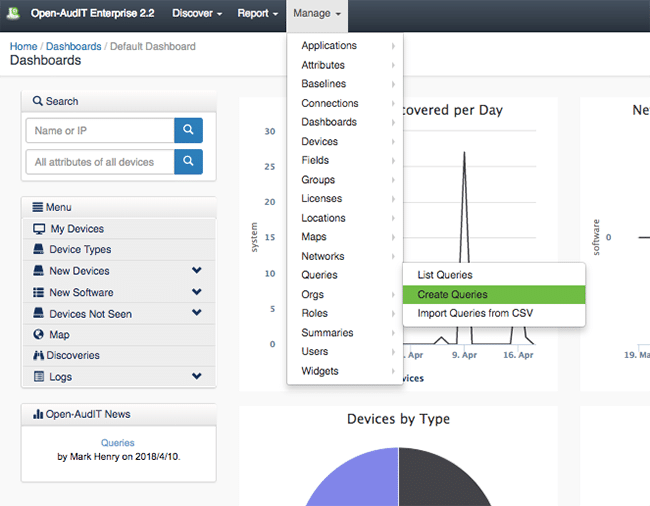
A query can be created in Open-AudIT by navigating to the menu -> Manage -> Queries -> Create Queries. 

The SQL query can be broken into three parts:

1. The SELECT statement is used to select the data from a database.

The SELECT section of the query should use full dot notation and also request the field with its full dot name. For example;

SELECT system.id AS `system.id`,

system.name AS `system.name`,

`system.os_name` AS `system.os_name`

This would cause the query to display the system id’s, system name, and operating system.

2.The FROM clause lists the tables, and any joins required for the SQL statement.

The FROM clause will decide what database you are getting these specific system id’s and should only contain the tables with the attributes you need.

For example – FROM system specifies which table the system.id and system.name is coming from.

3. The WHERE clause extracts only those records that fulfil a specified condition. For Open-AudIT to apply user permissions on items, we mandate the use of the WHERE @filter. If you do not use this format, the query::create form will show a warning.

Only users with the Admin role are permitted to create queries that lack this attribute. Continuing using our earlier examples we can add the clause WHERE @filter AND system.type = ‘computer’.  Specifying the type to equal computer will only display devices that are computers quickly allowing you to filter out all other irrelevant devices. The query has now reached its final form:


SELECT system.id AS `system.id`,
system.name AS `system.name`,
system.os_name AS `system.os_name`
FROM system
WHERE @filter
AND system.type = ‘computer’


This will result in displaying only the system names, id’s, and operating systems of devices that are the system type of computer.

NOTE – You are free to select any attributes desired when creating your custom query. To further help in creating queries it is a good idea to use the menu -> Admin -> Database -> List Tables to view the specific table structure. This provides a valuable resource for finding the attributes necessary when creating any custom query.

Open-AudIT grants you the ability to scan your entire network for devices and organize them in ways that make sense for your team. Inventory management is a breeze with the ability to find, filter, and group any device using custom queries. The growing number of different devices added to networks makes having tools like Open-AudIT in your kit more valuable than ever.

For more information on FirstWave’s Open-AudIT, other FirstWave solutions, or to schedule a demonstration, please visit our website at www.firstwave.com. You can also email us at contact@firstwave.com.

Getting Started, Configuring the Applications

Introduction

Getting up and running is as simple as finding the virtual machines IP and calling the application page’s URL. After that you will want to enter your license (or get a free license) and we would suggest using the Wizard to kick start your journey.

If you need additional configuration over and above what the wizard offers, our applications are all extremely configurable. The in depth material is hosted on each applications individual space within our wiki. For links to those, see the bottom of this page.

If you need assistance, feel free to ask on  Opmantek’s Community Questions site or contact Opmantek Support.

If you have more in-depth or unique requirements Opmantek is ready and able to customise our solutions to meet your needs – just ask!

Accessing the Application Modules on the VM

Finding the IP and hostname of the VM

Log in to the console using username: omkadmin, password: NM1$88 (you’ll need console access if you don’t know the IP to SSH to).

The default credentials can be found here.

By default the VM boots with DHCP enabled. On the command line run the below to determine the IP.
ifconfig | grep inet | grep -v inet6 | grep -v "127\.0\.0\.1"
To determine the VMs hostname, run the below.
hostname

Calling a URL

The applications can be access by using the URL http://{ip from above}/omk

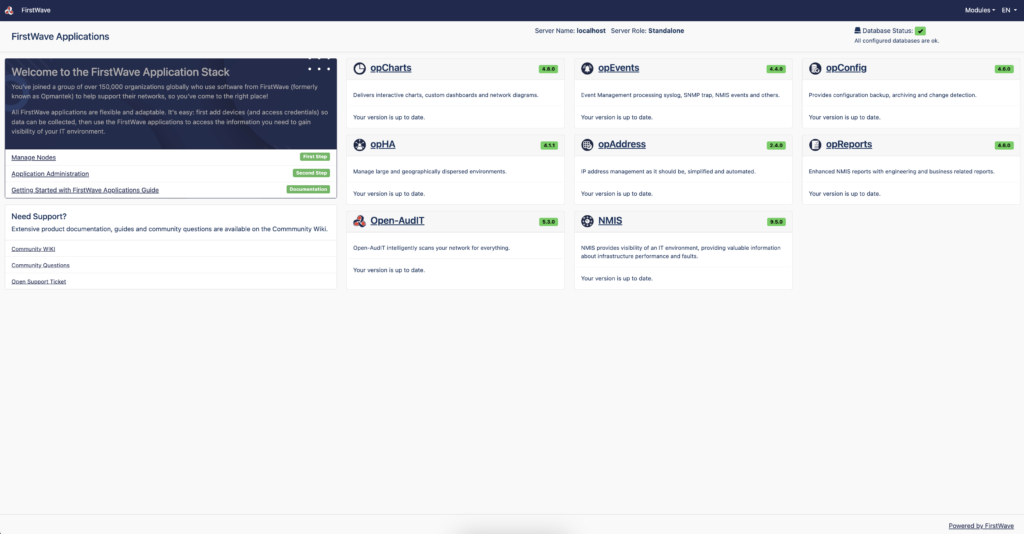
You will be presented with the following screen.

All the module names are clickable and link to the respective applications; but you can also navigate directly to NMIS, Open-AudIT or any of the other Opmantek applications.

Simply open your favorite web browser and navigate to:

  • NMIS 9 Virtual Appliance:
    • http://<vm ip address>/nmis9 for NMIS,
    • or http://<vm ip address>/omk for the list of all Opmantek applications.

The default access credentials are username “nmis”, password “nm1888” (more info regarding credentials can be found on this page).

Once you’ve got either the NMIS dashboard or one of the Opmantek application dashboards open, you can also navigate between modules using the “NMIS Modules” and “Modules” menus, respectively.

Getting Started Wizard

On the default /omk page you will see a section in the top left titled “Simple Configuration Wizard”. We highly recommend you use this to easily configure items such as authentication and email (among others).

Application Module Licensing

The first step to using a module is knowing how to open it, the next is to get a license for it. This process is simple and painless: all products on the appliance now support free licenses (which are not time-limited but limited to 20 nodes). For these applications the initial dialog offers the generation of such a free license.

Simply click “Activate a Free License”:

And then fill out the details, note these details are used for your license key and recovery information, ensure they are accurate:

You can also use the “opLicensing” module (reachable at http://<vm ip address>/omk/opLicense or from the Modules menu) to manage your licenses comfortably (including the ability to download previously purchased licenses from the Opmantek website). More info about opLicensing can be found here.

Exploring and Configuring Application Modules

All modules on the Virtual Appliance come with their configuration set to very minimal but safe defaults; to explore the full functionality available you will very likely have to make config modifications to suit your environment. These configuration options are all documented on the Opmantek Community Wiki, in the per-application section (or “Application Space”); certain common, shared aspects are discussed in the “opCommon” space.

For all recent Opmantek applications you’ll find links to the respective sections of Wiki in the “Help” menu (usually under “Online Documentation”); there’s also an online version check on the welcome/landing page, and on each application’s “About” page which helps with keeping your modules up to date.

Our individual applications are covered in great detail in their own wiki spaces (see below).

20 Years of Open-AudIT

A long, long time ago, in a town far, far away, I used to work for a financial institution. A small financial institution. Quite small. As in no IT management software small. As in if we wanted to update our desktops, we had to write a batch script and copy it “by hand” to individual devices and run it one at a time.

Once upon a time, my manager approached me and asked: “How many installs of MS Office do we have?”. I could not reliably answer the question, so I set about finding out how I would find out. At the time Microsoft had a product called SMS Server. Its purpose was to manage your Microsoft Windows PCs. It was also expensive. Well, it was expensive for a small financial institution. Expensive enough that my manager denied the funding and put me in a car to drive from north to south and record by hand the MS Office installs on 100 PCs across 12 branches and 200 kilometres. Good times!

I’ve always been the kind of guy who likes to write code. I think I first wrote some basic back in about 1982. Damn, I’m showing my age now! Obviously, I was thinking – well, if Microsoft can retrieve the information, then how? How are they doing that? That lead me to VBScript and WMI. For our Windows NT machines, these were optional components, but for our new Windows 98 machines, it was built in, yay! Yes – Windows NT and 98. Things are a little different now, but back then a lot of businesses looked at IT as a simple expense that they didn’t want. Hence as little money as possible was spent on it. Windows NT and 98 it was. And no management software for you.

OK, so I found VBScript and WMI. So what? I somehow need to write a script to retrieve details from PCs and actually store it somewhere. The obvious answer is in a database. We were a Microsoft shop, so SQL server. Uh oh – that costs money. No way. Funding denied. Sigh. Well, guess what? Further research turned up this software called “Open Source”. I could have a web server, a database and even an entire operating system FOR FREE. What? What is this voodoo? Oh, and the kicker – it would run on an old desktop PC we had retired. Call me sold.

I was so enamoured with the idea of open source that when requesting the project approval I stated that the code should be licensed under an Open Source license. I would write it by night at home and use it at work. The copyright would stay with me, but the business would benefit from having a tool to be able to list what software was on our machines. It would cost the business $0. Project approved!

And so was born WINventory. Windows Inventory. It was designed first and foremost to retrieve details from Windows machines. Along the way came a name change to Open-AudIT, a healthy community, the ability to audit network devices (routers, switches, printers, etc) as well as computers running various operating systems (Windows, Linux, MacOS, AIX, Solaris, etc). Open-AudIT has grown and grown.

We added the ability to run reports on the data. Even to make your own reports. To “discover” a network as opposed to running the audit scripts on individual PCs and so much more.

Today, almost 20 years later, I couldn’t be more proud of how far this little spare time project has come and what we’ve achieved. Nowadays I work for Opmantek and develop Open-AudIT for a full-time job. Since arriving at Opmantek, Open-AudIT has gone from strength to strength and shows no signs of slowing down. Indeed we have so many ideas that I don’t know how I’m ever going to realise them all!

So many ideas, so little time.

So that’s how Open-AudIT came to be. We’re not slowing down so get in, sit down, shush up and hang on!

Onwards and upwards.

Mark Unwin.