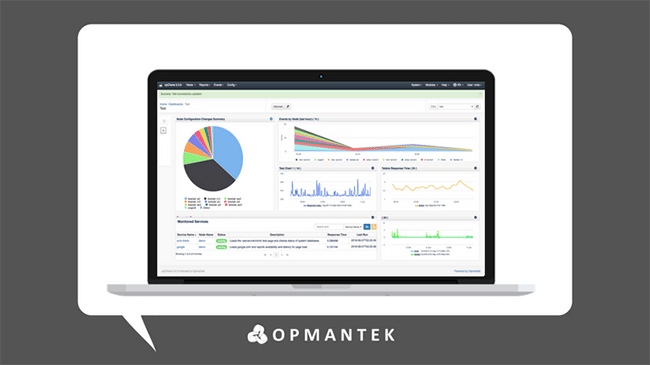
Using Compliance Management As a Task Sheet
It is extremely crucial for a network to be configured in a compliant manner, this can be due to relevant legislation but also to ensure the highest quality of service is delivered. Checks are needed on IT infrastructure assessing whether they are in compliance with rulesets that are implemented. This was becoming increasingly difficult with the scope of IT infrastructure that is now required to maintain strict SLAs, but now those checks can be transitioned from manual to automated.
opConfig has an incredibly powerful compliance engine built into it, that can be used to audit a network and ensure that all devices are compliant to a set of policies. The product ships with the CISCO-NSA best practices as the default compliance policy set, but adding your own custom policies is extremely easy to do. The Community page has all the resources you will need to create your own policies or editing some existing policies (located here).
However, the focus of this brief is what to do with the information that is provided once these policies are in place. There are two key ways to process this information and get your network back to being compliant depending on how many devices are required to fix.
The first is usually used if you have inherited a compliance problem, through mergers and acquisitions, for example, where a large number of devices are not compliant. The best process for this instance may be to push out new config to all devices. This can take longer than single item fixes but there is the knowledge that each device will be configured to the same baseline. Configuration pushes has been explained through our Community page and outlines a terrific example also (located here).
This leads to the most common occurrence where small changes to a device have been noted by the auditing system. The compliance report can be automated to be run each morning before a team’s scheduled start time and generate a report of devices that are not compliant. A lot of network engineers will use this as a task sheet for the day/morning, the report on one monitor and the required CLI on the other. As they have completed tasks their environment will become more compliant and the service levels will be increased.
The outcome of the report can be seen above. This exemplifies what the opConfig compliance engine will look for. The hit/miss category refers to the policies that are tested. If there is a configuration point that is testable for the policy this will result in a hit. If there is nothing available there will be a miss (note that a hit or a miss doesn’t imply there is a fault, it’s detailing a successful testing protocol). The second column refers to Exceptions and OKs, an exception will require changing configuration on a device, OK denotes that the device is acting in accordance to how the policy requires.
If you would like more information on these topics, navigate to the community forums in the links above or contact us using the links below.
Extending NMIS capabilities with Custom Tables
NMIS is a powerful tool right out of the box, however, if you take time to understand all it is truly capable of, you can customize it to fit almost any Network Management process. One useful feature NMIS users may not be aware of is the ability to create Custom Tables. This guide will take you step by step with a real-world example to help get your network working for you.
Step 1. Create a new NMIS Table Configuration.
For each known type of table there is a separate table configuration file all of which are named Table-<tableName>.nmis (e.g for the table Nodes.nmis the configuration file is called Table-Nodes.nmis). Both of these tables and their configuration files are located in the conf directory – /usr/local/nmis8/conf. The benefit of NMIS being open-source, is that this code can be modified and customized to display any information you reqquire. For this example we are going to create a Service Level Agreement (SLA) table to be able to assign devices to specific SLA levels (Bronze, Silver, Gold). Below is an example of what our new file Table-SLA.nmis will look like.
%hash = (
SLA => [{
Service_Level => {
header => ‘Service Level’,
display => ‘popup,header’,
value => [“Gold”, “Silver”, “Bronze”] }},
{ Email => {
header => ‘Email Address’,
display => ‘key,header,text’,
value => [“”] }},
{ Name => {
header => ‘Name’,
display => ‘header,text’,
value => [“”] }},
]
);
In order for you to understand what this code is displaying we will break it down into a few sections:
SLA => – This is the name of the table and it should match the naming convention from the filename, Table-<tableName>.nmis.
Service_Level => – Each Column in the table is defined with a similar entry like this. In this case the column would be called Service_Level. To finish defining the column the next necessary fields are the header, display, and value fields.
header => – This shows what will be displayed when the table is viewed. This example would display ‘Service Level’.
display => ‘key, header, text, popup’ – header indicates if it should be in the header or not, and text indicates what sort of input box to use. This section also includes key, this is included as the primary key if required. The popup display option makes a single value select box, this is equivalent to an HTML “select” form element. This example is displaying these three levels of service as a ‘popup’ display.
value => – Displays what is the default value or select list. Using this example the value will be set to either Gold, Silver, or Bronze dependent on the service level.
Now that there is an understanding of how the code is constructed, you can see that the next section, Email uses a header of ‘Email Address’. It is displayed using the display options of key, header, or text. Notice the value is set to empty quotes, this is because the user will enter the email address using the keyboard or the `text` display. The Name section of code is formatted in a similar fashion as the Email Address.
Step 2. Add the table to Tables.nmis.
Once your table configuration file (Table-SLA.nmis in this case) is created you need to add the table to the Tables.nmis file. This file lists all of the tables that are shipped with NMIS as well as any custom tables that are added. This next step can be easily accomplished by using the NMIS GUI.
To do this, go to the menu bar in NMIS and select System -> System Configuration -> Tables. Once the Tables menu appears, in the top right-hand corner of the table you should see Action > add. Enter the properties for the table, the table name must match the name in Table Configuration (SLA in our case). The “Display Name” is what you want to appear in the menu and the Description field is for remembering what the Table does. Once this is done, refresh the NMIS Dashboard and you will see your new table in the Tables table. You will not yet be able to access your table, this is because the permissions have not been defined for it.
Step 3. Create permissions in Access.nmis.
In order to get the table to display information, you need to give it Access permissions in NMIS. There is a script that was created to do just this. Run the following script to add default permissions to the newly created table:
/usr/local/nmis8/admin/add_table_auth.pl SLA
The SLA portion at the end of the script is, of course, the name of the table. You should see a message once the script is ran saying:
Checking NMIS Authorization for SLA INFO: Authorization NOT defined for SLA RW Access, ADDING IT NOW
as well as another similar message for View access. This script can be run multiple times, if you run the script again it will not add the table twice however, it will let you know if the permissions have been created for the particular table.
Step 4. Add data to your table.
Once there are correct permissions given to the table it’s time to add a data entry to it. Refresh the NMIS dashboard and navigate to your table – System -> System Configuration -> SLA for the current example. There will likely be an error message the first time you do this and it is because there is no data in the table yet.
To add data to the table click Action > add. Enter a name, level of service, and an email and click Add to save it. Now when you open your table you should see this information populated into it. This information is stored in /usr/local/nmis8/conf/SLA.nmis for the current example. If desired you can add to this file by using the same format as the first entry, if you don’t want to use the GUI, both methods work. That’s it, your new custom SLA table is created! You can create as many tables as you need and can take control of your team’s workflow. These custom tables are useful in NMIS but can also be used in Opmantek’s other modules such as opCharts.
Using your custom NMIS table in opCharts
If you wanted to display the SLA table or any other created table inside of the opCharts tables, there is a feature that allows table columns to be removed or added as desired. This feature is available for opCharts versions 3.2.2 and newer. An important note before starting is that the only views that support custom columns at the moment are the Interfaces view, Nodes view, Scheduled Outages view, and Node Context or Node Info Widget view.
Step 1. Edit the desired configuration file for the appropriate view.
A note of caution before changing anything, enable this feature with care, when upgrading opCharts you will need to watch closely since tables and node properties can change across versions. Upgrading opCharts can potentially break the functionality of a custom table configuration. If you use this feature it’s recommended to upgrade in a test environment before upgrading your production environment.
Enabling the Feature
In order to enable this feature the following must be done.
– Create a directory called /usr/local/omk/conf/table_schemas
– Copy the specific view configuration file that requires modification from /usr/local/ omk/lib/json/opCharts/table_schemas/ into /usr/local/omk/conf/table_schemas.
Note – Only the necessary JSON files should be copied to the /usr/local/omk/conf/table_schemas directory as having unnecessary configuration files in this directory can result in future upgrades being unpredictable.
With that said, each view has a separate configuration file. Depending on the opCharts view you wanted to add your NMIS SLA table to or any other table you would need to edit the appropriate file. Below is a list of the file names depending on the view you wish to display your table in:
Interfaces View – opCharts_interface-list.json
Nodes View – opCharts_node-list.json
Scheduled Outages – opCharts_outage-schema.json
Node Context – opCharts_node-summary-table.json
For our example, we are going to be using the Nodes View or opCharts_node-list.json. Start by editing the file with your favorite text editor – vi /usr/local/omk/conf/ table_schemas/opCharts_node-list.json .
Once you open the file you will notice it is formatted into a list of the tables already shown in opCharts Nodes view. The order that these sections of code are in determines the order the tables will be displayed. This means you can have your custom table in any order you wish, further, you can remove unwanted parts of a table by removing the entry from this file. For the sake of this example, I will be adding our NMIS SLA table to the bottom of this file causing it to display at the end of the row of tables. The entry for the SLA table should be similar to the following below:
{
“name”: “configuration.SLA”,
“label”: “Service Level”,
“cell”: “String”
}
The “name” section is the name of the node property and requires you to call the intended configuration file which in our case is the configuration file we created (SLA.nmis). The “label” section of code is what text will be displayed in the table column. “Cell” is the cell type and typically is left as “string”.
Step 2. Refresh the opCharts page
Once the file is edited, save it, check for syntax errors, and refresh the opCharts webpage. It is not necessary to restart any daemons. When the page has reloaded you should see your new column displayed on the table. The table is showing up, however, there is no data populated yet. To get data to appear we have to modify a few more files.
Filtering nodes by attributes in NMIS/opCharts
Now that you have your Service Level table in opCharts, what if you wanted to use the opCharts filter feature to display only the devices with a Service Level of Gold for example? This can be achieved by making a few quick changes.
Step 1. Modify Table-Nodes.nmis.
Start by editing the Table-Nodes.nmis file located at /usr/local/nmis8/conf/Table-Nodes.nmis. For this example, we will be adding our Service Level field.
Insert the new field between the ‘extra_options’ entry and the ‘advanced_options’ entry. You can choose where you want this to display in NMIS, but if you follow this guide it will display underneath the Extra Options section in the Nodes Table in NMIS.
The code in bold below shows an example of where I chose to insert the SLA table. This section is similar to the layout of our Table-SLA.nmis file with one key difference, the added validation rule ‘onefromlist’. This rule indicates that the property value must be one of the given explicit values (Bronze, Silver, Gold), or one of the default display values if no other values are given in this rule.
{
netType => {
header => ‘Net Type’,
display => ‘popup’,
value => [ split(/\s*,\s*/, $C->{nettype_list}) ],
validate => { “onefromlist” => undef } }},
{
location => {
header => ‘Location’,
display => ‘header,popup’,
value => [ sort keys %{loadGenericTable(‘Locations’)}],
validate => { “onefromlist” => undef } }},
{
SLA => {
header => ‘Service Level’,
display => ‘header,popup’,
value => [“Gold”, “Silver”, “Bronze”],
validate => { “onefromlist” => undef } }
},
Step 2. Verify your table is rendering properly
Navigate to the NMIS GUI and in the top menu go to System -> System Configuration -> NMIS Nodes. If the steps were correct it will display a ‘Service Level’ column.
Step 3. Modify Config.nmis
Open and edit the Config.nmis file with your favorite text editor. This file is located at
/usr/local/nmis8/conf/Config.nmis . Add the table name (SLA) into the list following the format of the other entries. A snippet of what this code looks like using our example is shown below:
‘node_summary_field_list’ => ‘host,uuid,customer,businessService,SLA,serviceStatus,snmpdown,wmidown,
remote_connection_name,remote_connection_url,host_addr,location’,
Step 4. Modify opCommon.nmis
Add the new field to the opcharts_node_selector_sections in opCommon.nmis. The opCommon.nmis file is located at /usr/local/omk/conf/opCommon.nmis Follow the format of the code already present adding a new section for our Service Level table ‘SLA’. A snippet of what this code may look like is below:
‘opcharts_node_selector_sections’ => [
{
‘key’ => ‘nodestatus’,
‘name’ => ‘Node Status’
},
{
‘key’ => ‘group’,
‘name’ => ‘Group’
},
{
‘key’ => ‘roleType’,
‘name’ => ‘Node Role’
},
{
‘key’ => ‘SLA’,
‘name’ => ‘SLA’
},
Step 5. Verify the changes worked properly.
After making changes to the opCommon.nmis file, be sure to save them and then perform a restart of the omkd service – service omkd restart. Once the service is restarted open a browser and navigate to the Nodes view in opCharts. The new field should be on the table as well as in the Node Filter menu on the left. If you are following this example, the ability to filter by SLA should appear. Simply click the filter and choose the
Service Level and the nodes should be filtered depending on the level of service assigned to them.
Conclusion
Network environments are widely different as are their network engineers, this significantly changes what information is important to report on. NMIS and opCharts, as well as Opmantek’s other modules, allow for incredible levels of customization, they give the ability to report on the information that suits you.
For more information about NMIS and opCharts and all of their features, visit our website or email us at contact@opmantek.com.
Event Correlation with opEvents
As a support engineer with Opmantek, I work with many organizations that monitor thousands of devices across their networks. In complex network environments, thousands or even millions of events are generated in a short period. These events range from critical to informational, identifying and understanding the two is key to keeping a network running efficiently.
Looking through event logs is tedious, and with many events, it’s easy to miss the critical ones. Engineers have told me they stopped looking at event notifications because there were so many happening, they became nonchalant about them. Opmantek’s event management solution, opEvents not only reduces event spam but, can also be used for effective time and event management.
A team of engineers at a large organization were being bombarded by events from hundreds of machines during their regularly scheduled Windows update period. This team ignored event notifications during this time since they occurred so frequently. However, at the same time, they had multiple notices that a group of servers along with their services had gone down. The event logs were indicating that this was happening, the IT staff were notified but, since it occurred during a typical busy event period, they were ignored. As a result, these servers stayed down until someone finally noticed the event hours later. This downtime resulted in lost revenue for the company and some very unhappy managers.
It was discovered that this problem occurred due to a router that stopped working. The team looked for a solution and came upon Opmantek’s opEvents. With opEvents, your organization gains the ability to sort and correlate multiple events from various sources into a single event. This reduces event spam and clutter to help your team quickly identify which events are important and which are not. opEvents will intelligently analyze, sort, and correlate multiple events across various sources into a single event, reducing noise before any alert is created. This team of engineers can now quickly identify not only when a router is entirely dead but, also see if any router is underperforming preventing any future downtime, making the team more proactive.
The team of engineers in the example above discussed how opEvents could be used to prevent a situation like this from occurring again. They came up with an event correlation rule to notify them in similar cases.
To create this type of correlation rule, start by navigating to the conf directory of your opEvents install and creating an entry in EventRules.nmis.
A simple event correlation rule consists of:
- An event name, specifying the name of your newly created event.
- A list of event names that are the events desired for correlation
- A minimum count of events that have to be detected to trigger the rule
- An optional list of groupby clauses. These define whether the count is interpreted globally for all named events, or separately within smaller groups.
- An optional enrich clause. This adjusts the content of the newly created event.
- Last a window parameter, which defines the time window to examine for the event.
An example event correlation rule is shown below:
‘3’=> { name => ‘Customer Outage’, events => [“Node Down”,”SNMP Down”], window => ’60’, count=> 5, groupby=>[‘node.customer’], # count separately for every observed value of customer enrich=>{priority => 3, answer => 42}, # any such items gets inserted in the new event }, The example shows an event correlation event rule indicating that when the events “Node Down” and “SNMP Down” are triggered within a 60-second window, separate them into per-customer groups; if it counts 5 or more events in a group, then create a new event called Customer Outage. This is only one example of a custom event correlation rule. There are many more examples, use cases, and features that are discussed more on our opEvents Wiki page.
Using this Event Management tool will reduce event spam allowing your team to notice critical events that need action quickly. Important events will be harder to overlook during event storms. Redundant events can be reduced by automating event handling. Save time, reduce operational costs, gain network insight, and keep your network performing smoothly. Expand your toolkit with these features and more in opEvents and take control of your network.
For more information on Opmantek’s Event Management Tools, other Opmantek solutions, or to schedule a demonstration, please visit our website at www.opmantek.com. You can also email us at contact@opmantek.com.
[CASO de ESTUDIO] CLARO CENAM COMPAÑÍA DE TELECOMUNICACIONES
Benefits of Developing a Strategic NOC Service
Integrating automation is a crucial step in developing your IT department into a beneficial business contributor to a company. However, automation alone will not achieve this; there also has to be a shift in ideology towards improving the user experience inside the business.
When a traditional Network Operations Center (NOC) is present, the fault response is reactionary, and monitoring focuses on equipment state and roles are usually split between fault resolution and routine maintenance. Pressure on NOCs has never been higher, increasing the requirements of greater network performance while simultaneously reducing downtime puts increased stress on a NOC.
By using a strategic NOC model, the stress implications can be significantly reduced. A strategic model will focus on improving the collaboration between all lines of business, increasing user satisfaction and ensuring that there is an end-to-end quality of the network. This model looks into the application performance rather than the equipment performance. A vital example of this may be that the internet is currently connected, but Office365 is down, this will affect the user experience and decrease productivity despite the hardware states being unaffected.
To facilitate this transition to a strategic NOC, automation is required with the goal to increase user experience (UX) not save on overheads; the emphasis is on improving the UX which leads to increased productivity. This can be exemplified by Visa’s 75% reduction in time to resolve incidents, and JPMorgan Chase’s 75% first call resolution rate (Reference). Both those figures were attained by utilising the core principles that a strategic NOC operates on.
To find out more about these principles, understand how to develop a service catalogue or to architect a solution for fast client on-boarding register your interest at our free webinar (Link).