[CASO de ESTUDIO] CLARO CENAM COMPAÑÍA DE TELECOMUNICACIONES
LA COMPAÑÍA DE MSP AUTOMATIZA LA GESTIÓN PARA ASEGURAR LA ADMINISTRACIÓN DE EVENTOS ACORDE A ITIL 3


Integrating automation is a crucial step in developing your IT department into a beneficial business contributor to a company. However, automation alone will not achieve this; there also has to be a shift in ideology towards improving the user experience inside the business.
When a traditional Network Operations Center (NOC) is present, the fault response is reactionary, and monitoring focuses on equipment state and roles are usually split between fault resolution and routine maintenance. Pressure on NOCs has never been higher, increasing the requirements of greater network performance while simultaneously reducing downtime puts increased stress on a NOC.
By using a strategic NOC model, the stress implications can be significantly reduced. A strategic model will focus on improving the collaboration between all lines of business, increasing user satisfaction and ensuring that there is an end-to-end quality of the network. This model looks into the application performance rather than the equipment performance. A vital example of this may be that the internet is currently connected, but Office365 is down, this will affect the user experience and decrease productivity despite the hardware states being unaffected.
To facilitate this transition to a strategic NOC, automation is required with the goal to increase user experience (UX) not save on overheads; the emphasis is on improving the UX which leads to increased productivity. This can be exemplified by Visa’s 75% reduction in time to resolve incidents, and JPMorgan Chase’s 75% first call resolution rate (Reference). Both those figures were attained by utilising the core principles that a strategic NOC operates on.
To find out more about these principles, understand how to develop a service catalogue or to architect a solution for fast client on-boarding register your interest at our free webinar (Link).
This was the phrase that started it all, this forced Open-AudIT founder Mark to develop the Open-AudIT software. Fast-forward almost 20 years and similar questions are still being asked in many organisations worldwide. What has changed though is the process of acquiring this information, 20 years ago Mark drove to each location and manually counted each install. Today to get this same information, a report can be run and it will take a few seconds. The more proactive user will have this report scheduled and waiting in an inbox whenever desired.
The goal extends further than a counting exercise, there is now a lot more at stake. Formerly, software licensing was the number of installs, but this process has expanded and become more complicated. Gartner has presented guidelines to leverage the current software licensing that is in place using Software Asset Management.
The first steps, however, are fundamental to what Open-AudIT does as an open source program. Device Discovery and Inventory Management are two core principles behind Open-AudIT and they also coincide with the first two steps in minimising your software licensing spend.

The Internet of Things (IoT) has led to many businesses capitalising on the computational potential and the increase in data available in everyday objects. The breadth of devices with internet connectivity has been increasing exponentially, CEB (CEBglobal – IoT Security Primer) suggests that the number of connections will grow from 6 million in 2015 to 27 billion by 2025. This increase has led to many new products and many new vendors operating in a market that can be vulnerable to catastrophic attacks. They continue by saying almost 40% of businesses believe that Poor Visibility and Understanding is their leading risk management challenge.
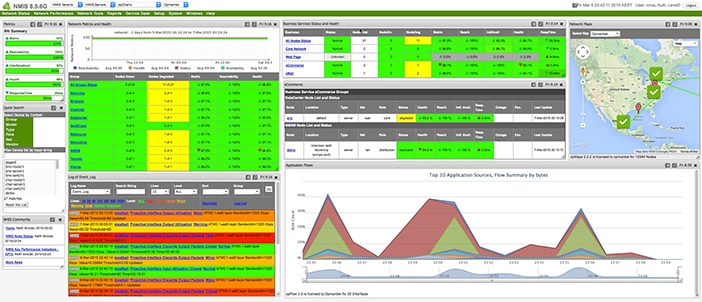
The underlying problem with a network that is considered to have poor visibility is the limited ability to discover everything that is connected to it. NMIS can manage any device that has an IP address, so if it is connected to your network, directly or indirectly, NMIS will know.
With the evolution of devices, there should be equal to greater sophistication in the understanding practices that are used to monitor devices. NMIS collects information from any device on your network and by using the ‘sysObjectId’ variable, it can attribute a vendor to the device from the Enterprise list. The list of vendors is continually expanding, you can peruse the most common list here. However, the true functionality of NMIS is the ability to control new vendors. This process is better explained – Here!
The increased visibility combined with custom thresholding using NMIS, there will be greater control over your network. Users of NMIS will be familiar with SNMP and device modelling, but there are more custom controls that are available. Watch Keith Sinclair (Opmantek CTO) present a webinar that walkthroughs the use of MIBs for custom function, device modelling and custom thresholding. This webinar is located – Here!
Here at Opmantek, we are constantly looking for new ways to help your workday. If you have any feature requests, webinar topics or ideas you would like to see get developed, don’t hesitate to reach out.
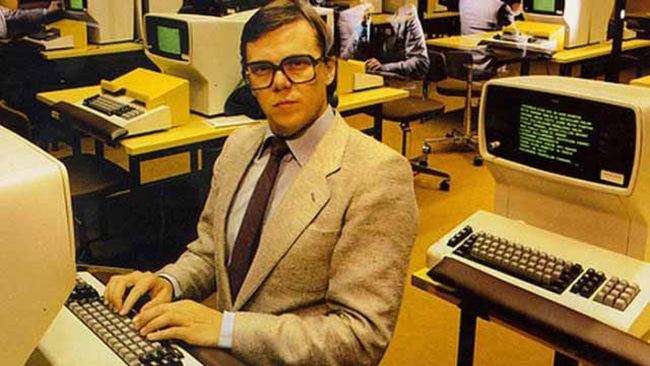
A long, long time ago, in a town far, far away, I used to work for a financial institution. A small financial institution. Quite small. As in no IT management software small. As in if we wanted to update our desktops, we had to write a batch script and copy it “by hand” to individual devices and run it one at a time.
Once upon a time, my manager approached me and asked: “How many installs of MS Office do we have?”. I could not reliably answer the question, so I set about finding out how I would find out. At the time Microsoft had a product called SMS Server. Its purpose was to manage your Microsoft Windows PCs. It was also expensive. Well, it was expensive for a small financial institution. Expensive enough that my manager denied the funding and put me in a car to drive from north to south and record by hand the MS Office installs on 100 PCs across 12 branches and 200 kilometres. Good times!
I’ve always been the kind of guy who likes to write code. I think I first wrote some basic back in about 1982. Damn, I’m showing my age now! Obviously, I was thinking – well, if Microsoft can retrieve the information, then how? How are they doing that? That lead me to VBScript and WMI. For our Windows NT machines, these were optional components, but for our new Windows 98 machines, it was built in, yay! Yes – Windows NT and 98. Things are a little different now, but back then a lot of businesses looked at IT as a simple expense that they didn’t want. Hence as little money as possible was spent on it. Windows NT and 98 it was. And no management software for you.
OK, so I found VBScript and WMI. So what? I somehow need to write a script to retrieve details from PCs and actually store it somewhere. The obvious answer is in a database. We were a Microsoft shop, so SQL server. Uh oh – that costs money. No way. Funding denied. Sigh. Well, guess what? Further research turned up this software called “Open Source”. I could have a web server, a database and even an entire operating system FOR FREE. What? What is this voodoo? Oh, and the kicker – it would run on an old desktop PC we had retired. Call me sold.
I was so enamoured with the idea of open source that when requesting the project approval I stated that the code should be licensed under an Open Source license. I would write it by night at home and use it at work. The copyright would stay with me, but the business would benefit from having a tool to be able to list what software was on our machines. It would cost the business $0. Project approved!
And so was born WINventory. Windows Inventory. It was designed first and foremost to retrieve details from Windows machines. Along the way came a name change to Open-AudIT, a healthy community, the ability to audit network devices (routers, switches, printers, etc) as well as computers running various operating systems (Windows, Linux, MacOS, AIX, Solaris, etc). Open-AudIT has grown and grown.
We added the ability to run reports on the data. Even to make your own reports. To “discover” a network as opposed to running the audit scripts on individual PCs and so much more.
Today, almost 20 years later, I couldn’t be more proud of how far this little spare time project has come and what we’ve achieved. Nowadays I work for Opmantek and develop Open-AudIT for a full-time job. Since arriving at Opmantek, Open-AudIT has gone from strength to strength and shows no signs of slowing down. Indeed we have so many ideas that I don’t know how I’m ever going to realise them all!
So many ideas, so little time.
So that’s how Open-AudIT came to be. We’re not slowing down so get in, sit down, shush up and hang on!
Onwards and upwards.
Mark Unwin.

The act of automation can greatly improve the efficiency of any network team. With regards to managing network infrastructure, Gartner suggests that any manual task performed more than 4 times a year should be automated. These mandates are usually answered by the more proactive teams and remain a fancy for most teams struggling with limited resources. However, the initial cost, in time or budget, is minor compared to the ability to leverage the opportunity costs of reducing human error, improving compliance and increasing work availability of staff.
Process automation is becoming a requirement because humans may no longer be able to manually keep up with real-time configuration changes. The prioritization of automation technologies enables a business to become more agile and responsive to shifting market/customer requirements.
The fast-approaching addition of the GDPR compliance standard to existing standards, PCI or HIPAA for example, will require businesses to be less passive with risk management. Risk should be managed and not avoided, GDPR acts as an invitation to change traditional business protocols because there is no avoiding the GDPR. To mitigate the risk of the GDPR improved compliance and accurate reporting is required, both rewards to successful network automation.
A common misconception regarding automation is that the outcome reduces the size of a team. This can occur in a reactive business, but a proactive business will transfer the workload from one project to another. The ability to cross train or upskill staff will make your team more valuable. There is the added benefit of becoming more agile in your approach to transitioning workflow from administrative tasks towards managing infrastructure or increasing client satisfaction.
Configuration and Compliance Management is now easier to implement with opConfig. opConfig will continuously monitor the configuration of devices discovered by Open-AudIT Enterprise or managed by NMIS, track the changes and store a complete history of configuration information. opConfig can leverage NMIS’ business policy engine, opEvents, to provide instantaneous correlation and notification when device configurations change or stray from enterprise policies. The combination of these systems will aid in your network automation, assist in the quick resolution of problems and compliance with standards.