System Automation Through Integration

I have the pleasure of working with dozens of engineers every month from companies all over North America. No matter the type of business they work for I have found they all have one thing in common – they’re all trying to maintain larger and more complex networks with a smaller team of staff.

Network management systems strive to automate the user experience, from the implementation of complex scheduling systems to the use of heuristics engines to assist with event handling. The one piece that is often missing is the maintenance of the monitoring solution itself. Recently Opmantek had the opportunity to address this issue head-on. What we did, how it works, and the results we achieved are the subject of this article.

Like many North American businesses, our client, a large multinational corporation, had grown over the years through several mergers and acquisitions. Their infrastructure management consisted of several disparate platforms from more than a dozen vendors.

Our implementation services include a series of up-front workshops designed to elicit information and feedback from all levels; engineer to upper management. When we conducted these investigative meetings we discovered many challenges and pain points specifically to our client’s business. We also learned that they had Service Now – a configuration management database (CMDB) – that was being used as the company’s single source of truth for all equipment inventory. This gave us an idea…

Service Now, like most modern CMDB systems, includes a very robust application programming interface (API). Using this API we were easily able to create an integration which would pull a list of active devices, compare them to the devices currently being monitored, and reconcile the list by adding new devices, updating existing devices, and even retiring devices from monitoring when they were marked as out of service.

Our architectural solution for this client included a series of geographically diverse polling engines all rolling-up to a series of redundant primary servers. Each layer offering multiple methods of redundancy and failover. Our integration with Service Now accounted for this, automating the assignment of devices to polling engines geographically, even supporting devices with different service levels; some need 1 or 2 assigned polling engines.

To further enhance the system, we also automated the assignment of devices to opConfig, our Configuration and Compliance Management solution and opEvents, our intelligent event management system which provides event correlation, deduplication, and action automation. These solutions were then complemented by the addition of opTrend, which expands on Opmantek’s already expansive thresholding and alerting system by implementing a highly flexible Statistical Exception Detection System (SEDS), Igor Trubin’s methodology, that learns what’s normal behavior on the client’s network and adjusts thresholding dynamically based on historical usage for every hour of each day of the week.
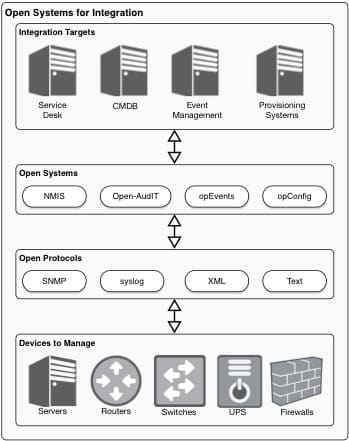
Our Phase 1 implementation focused on network devices and have allowed the client to consolidate their monitoring platform to a single Opmantek based solution, decommissioning several other systems. In our next Phase, we will be automating the monitoring of their expansive server network. This effort will continue to leverage the information in Service Now; allowing us to monitor services and applications, generate synthetic transactions to exercise each application tier, and continue to expand their view across the enterprise through a single pane of glass.
The last piece of this puzzle was the addition of Service Assurance and Monitoring. This provides an additional layer of support through monthly server checks, software upgrades, and 24/7 monitoring of the monitoring solution. With these solutions in place the client needn’t worry that they will miss an event because their monitoring solution wasn’t up-to-date or worse, wasn’t functioning as designed.

In all, Opmantek’s integrated solution has now removed the maintenance needed to maintain most network monitoring systems, ensured all devices are properly monitored to the correct SLA and delivered an enterprise-class solution through a single pane of glass.

Uncategorized

Improve Mean Time to Resolution Using NMIS Automated Base Lining

Managing a large complex environment with ever changing operational states is challenging. Several of our engineers who previously managed shifts in large 24hr Network Operation Centres described how they used Automated Live Base Lining when starting a shift and during shift handovers to immediately understand a network’s current health and recent history. NMIS Live Base Lining was able to provide them with a fast synopsis of current network stability and an ability to quickly drill into the most relevant occurrences.

Live base lining is achieved by automatically calculating a single “network wide” health metric, reachability metric and availability metric as seen in this graph.

The secret to showing engineers where to look for deteriorating conditions is that the current state (metrics) of your network are then continuously compared against a rolling period (configurable, last 8 hours by default) to see whether performance is deteriorating or improving. This is done not only on the network as whole but also on subsections (groups) of your network.

Status trends are reported visually using arrows to show if health is improving or declining. You can then drill-down into more detailed KPI data for an individual device.

The visual alerts, along with the ability to very quickly access detailed information relating to performance deterioration allow an organization to identify issues and make corrective decisions faster – vastly improving mean time to resolution (MTTR).

Uncategorized

Baselines in Open-AudIT

Our new major feature for 1.10 is the beginning of our Baselines feature. This is not finished as yet (in 1.10), but we wanted it out there for feedback. Baselines in Open-AudIT Enterprise allow you to take the details of one machine (say it’s software list) and use that as a basis for comparison against another machine or group of machines.

Being able to determine which machines are configured the same is a major part of systems administration and auditing – and now reporting on that will be made simple and automated. Once you define your baseline it will automatically run against a set of devices on a predetermined schedule. The output of these executed baselines will be available for web viewing, importing into a third party system or even as a printed report.

For example – you might create a baseline from a device running Centos 6 which acts as one of your apache servers in a cluster. You know this particular server is configured just the way you want it but you’re unsure if other servers in the cluster are configured exactly the same. Baselines enables you to determine this.

So you can say “Take the software installed on device X and tell me where it’s different on all the machines in the Web Servers group.”

You get a nice GUI interface showing which machines did or did not meet the expected software install state. You can also apply this to users and netstat ports. Other tables will be introduced in the future.

Our initial release (in 1.10) is functional but not yet complete. You can create a baseline, run it against a group of devices and view the results in a web browser. We plan to add scheduled execution, more tables for comparison (currently only software, netstat ports and users are enabled), in place baseline and policy editing, archiving of results, exporting of results and more.

A sample baseline definition screen is below. In this example we show a baseline consisting of software policies targeted at Centos 6 devices.

Once this has been run against our target group we have a result which is below.

From our result page we can inspect individual devices or individual policies for compliance.
Once we have completed the implementation of Baselines in Open-AudIT you will see how powerful this feature can be for reporting items like compliance, ensuring device consistency and more. Stay tuned for more Baselines in our next Open-AudIT release!

Terms:

Baseline – the overarching document that contains the baseline definition and the individual policy tests.

Policies – The individual tests contained within a Baseline. Each test is for a specific item. An example would be testing for SSH version 1.2.3.

Uncategorized

How to extend NMIS with OpModules

Looking to extend the features and functionality of NMIS, but not sure where to start? We’ve put together a product selection guide to help you tailor a network management solution to meet your organization’s requirements using our range of modules.

Click Here to Download the PDF

Uncategorized

Open-AudIT Enterprise License Changes (for the better)

Great news everyone – FirstWave now provide a free license for 20 devices that is not time limited. That’s right – you can now use Open-AudIT Enterprise on 20 devices for free, forever. We don’t mind if you’re a small business owner, a student or just have an extensive home network. Open-AudIT Enterprise is free for you to use on 20 devices.
This is a change from our old “25 devices for 30 days” license that customers tended to find expired rather quickly. We feel it will allow our users to better evaluate Open-AudIT – including using it as a test system. You can run it at home, at work or wherever you like.

Of course Open-AudIT Community is still free and open source software, just as it always has been. And now for added extra bonus points, the source is available on GitHub. Feel free to fork it and contribute back for both your own and everyone else’s benefit.

It’s now even easier to see “What’s on your network”!

Maps, Scheduled Discovery, Dashboard, Scheduled Reports, Enterprise specific “over time” reports – it’s all there, waiting for you to use free of charge.

Why is FirstWave doing this?

Besides the fact that FirstWave and our staff all love open source (we have built the company on it, after all), we feel that allowing users to actually experience Open-AudIT Enterprise without having to worry about when their trial license will expire will remove some of the weight and urgency around evaluating our software. It will also allow users to install and use Open-AudIT in testing environments without worry and knowing what they’re using is exactly the same as what they see in production. Users can try out various aspects of the software free from worry about breakage of their important data.

What do I get in the Free license?

You get everything a paid for license gets in terms of the software and it’s features. Obviously we cannot offer our enterprise grade support for nothing, so we do keep that for our paying customers. There is always FirstWave Questions and the Open-AudIT forums though. We have many contributors who are happy to help where they can. Some users though simply require support and know that if they have an issue, FirstWave is there to assist.

We do encourage our users to consider a paid license where they can as this helps FirstWave, which in turn helps Open-AudIT. We love open source, but we need to eat!

Will I see anything new in the software?

In short – yes. We have added a new modal to Open-AudIT that will detail the Open-AudIT Enterprise offering. If you don’t wish to see it, it is easily dismissable. We even provided a “don’t show me again” option. We think that’s a very fair trade. Dismiss it if you don’t want to see it 🙂

Will the Open-AudIT source be altered to make using Enterprise required?

Absolutely not. Open-AudIT is free and open source software. Always has been. Always will be. It’s on GitHub. We do happily accept code contributions though and would encourage users to contribute to the main project rather than blindly fork it. We obviously spend a lot of time developing Open-AudIT and will continue to do so going forward. A fork (for forks sake) would likely require considerable effort just to stay current. Why not simply contribute to the main project and let us do it for you? It’s called upstreaming.

We hope you like the changes and we hope you will install, test, play with and improve Open-AudIT with us.

What if I want more than 20 devices in Open-AudIT Enterprise?

FirstWave offer very attractive 12 month subscription licenses for Open-AudIT Enterprise. 100 devices is just $249 US and 500 devices is just $799 US – and both include our awesome support package! If you would like even more devices, please hit the Contact Us link on FirstWave.com and a staff member in your geographical area will contact you ASAP. We have staff in Europe, USA, South America and Australia.

We love open source and we know you do as well. Let’s improve it together and at the same time, help make your life easier.

Uncategorized

Update Device Attributes In Bulk With Open-AudIT

Open-AudIT provides a simple and powerful way to edit the attributes of multiple devices at the same time. Using this feature enables Administrators to quickly and easily update 1,000’s of devices with manually set values for attributes such as device location, type, purchase details, credentials, etc.

Any user of Open-AudIT with an access level of Edit Details on a given group can edit the devices in that group. You can check the access level of any user by going to menu -> Admin -> Users -> List Users.

To use the bulk edit feature on a select list of devices, first view the group that contains the devices that you have Edit Details level access to. Don’t worry if the Group doesn’t contain every device you need to edit – you can always repeat the process on another Group. It’s simply faster to select a group that contains as many devices that you wish to edit as possible as the process can be performed potentially only a single time. You should see a list of checkboxes on the right hand side of the view. Selecting a checkbox marks that device to be bulk edited. You can toggle selecting all devices by clicking the checkbox in the table header row.

Depending on the number of devices you wish to select, it may be faster to select all devices, then deselect certain devices – or the other way around.

After selecting the desired devices, click the Edit button in the table header row. You will be sent to the Edit Systems form. You can view the selected devices in the table below the form (you may need to scroll down to see the table).

From this form, any attributes values you set will be applied to all devices in the table below. To remove that value of an attribute, insert a dash ‘-‘ into the field in question. Leaving a field blank will not remove the attributes value in the database – they will not be changed. Inserting a dash/minus symbol tells Open-AudIT “this attribute should have it’s value set to blank”.
When you are done, click the Submit button.

That’s all there is to it!

Now imagine a more advanced scenario – I wish to set all my VMware based Linux servers ‘class’ attribute to virtual server.

I select the group Gnu/Linux systems. I run the report Device Hardware. I mouse over a device’s manufacturer that is VMware, Inc. Three stars appear (\*\*\*), which I mouse over. A pop-over appears that contains Filter Out and Filter Only. I click the Filter Only option. Te report the re-runs and shows only those devices that have a manufacturer of VMware, Inc. I click the Select All checkbox in the table header and then click the Edit button. From the Edit Systems form I now set the class to Virtual Server – done!
I have just edited from 1 to any number of devices in 6 clicks!

You can apply the same logic for setting devices in locations, in organisations (maybe departments), etc, etc. When you need to update manually supplied data to multiple devices which is the same, Bulk Editing can save you (literally) hours.

Uncategorized